In this post I’m going to share some data on how Edmontonians are using Instagram1. This data was collected using the Instagram API over the 30 days between June 9 and July 8. My aim in this post is not to try to quantify every Instagram photo posted in Edmonton, but rather to give you a flavor of what Instagram usage looks like in our city.
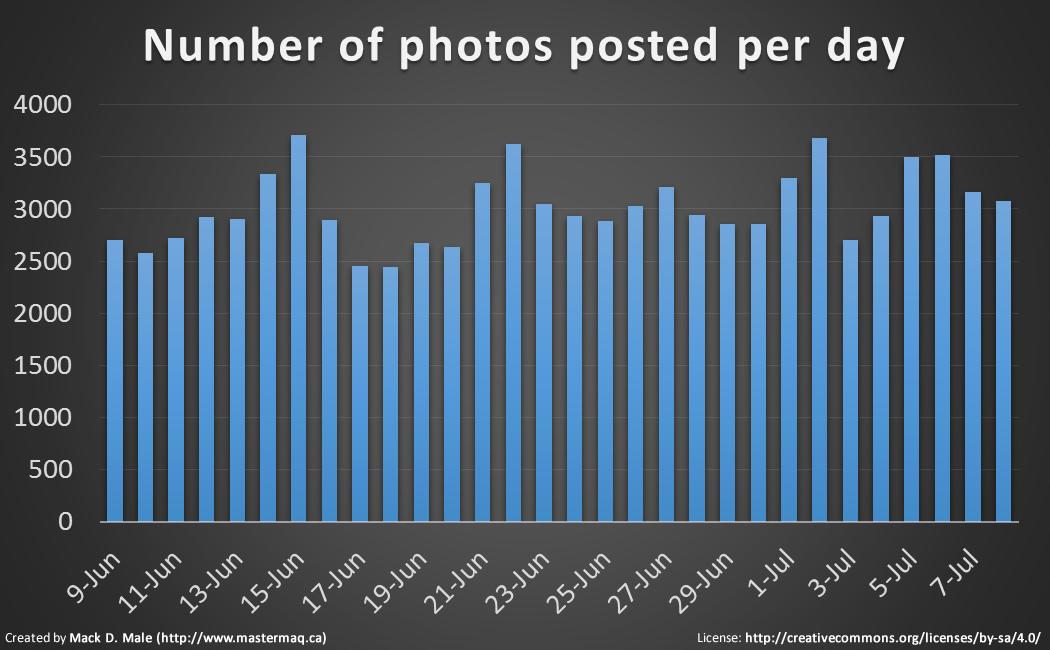
During the month in question, I tracked 90,679 total photos posted by 15,395 different users. The average number of photos posted per user was 6, while the median number was 3. Just 4 users posted more than 200 photos over the month, while 25 users posted 100 photos or more.
Filters
One of the things I was most interested in was filter usage. Which filters are the most popular? It turns out that 59% of all photos posted did not use a filter at all! Here’s the breakdown:
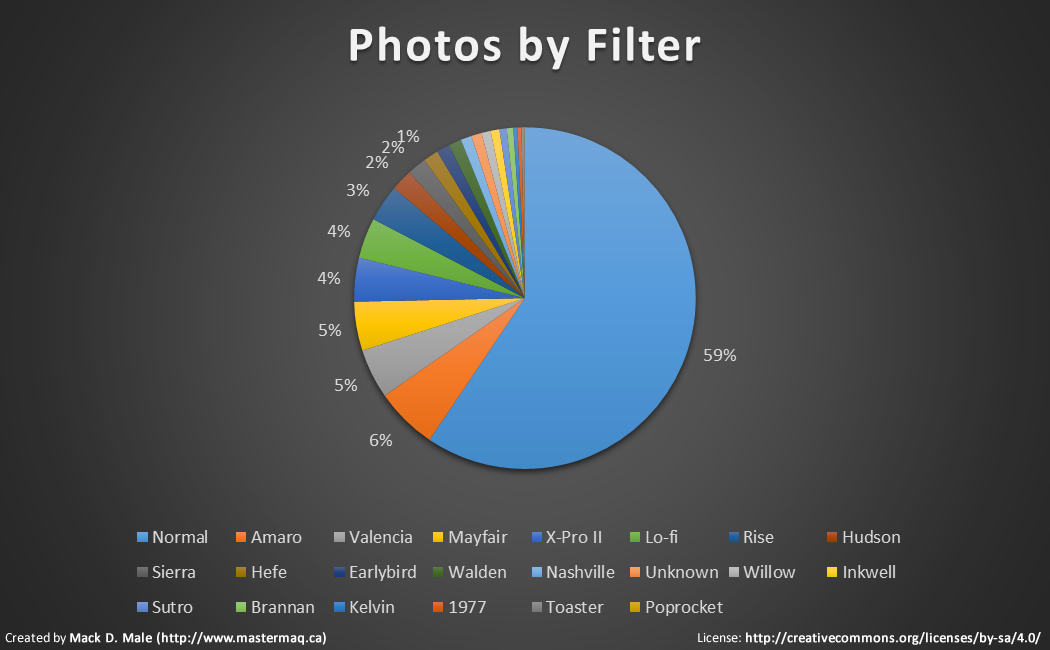
The top five filters were: Amaro, Valencia, Mayfair, X-Pro II, and Lo-Fi.
Likes & Comments
I tracked the number of likes & comments posted on each photo for a short period of time only, so some may have accumulated more over the course of the month than I captured. A total of 15,825 photos or 17.5% received no likes, while just over 64,000 or 70.7% received no comments.
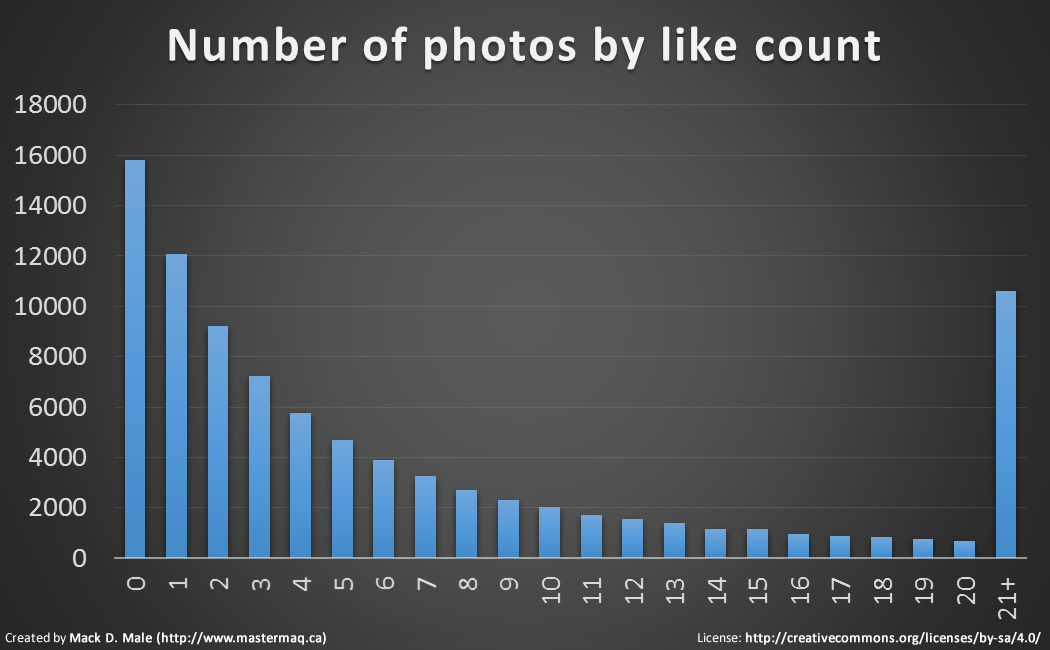
The average number of likes a photo received was 13, and the average number of comments received was less than 1. One photo received more than 4,000 likes and one received more than 260 comments.
Tags
Here’s a tag cloud of all the tags used on the photos posted during the month:

Here are the top 25 tags used:
- yeg
- love
- edmonton
- summer
- cute
- instagood
- follow
- photooftheday
- followme
- beautiful
- selfie
- tagsforlikes
- tbt
- like4like
- girl
- happy
- smile
- picoftheday
- canada
- instadaily
- tflers
- food
- likeforlike
- amazing
- bestoftheday
Roughly 40,252 or 44% of the photos posted did not have any tags.
Neighbourhoods
One of the interesting things about Instagram photos is that they are geotagged. That means I was able to see where in the city they were posted. A total of 349 neighbourhoods had at least one photo posted. Here are the top 25 neighbourhoods by number of photos posted:
- Downtown
- Oliver
- Strathcona
- University of Alberta
- Garneau
- Queen Alexandra
- Summerside
- Westmount
- Cumberland
- Queen Mary Park
- Boyle Street
- Ritchie
- Summerlea
- McCauley
- Central McDougall
- Edmonton Northlands
- Brintnell
- Rutherford
- River Valley Victoria
- Inglewood
- Alberta Avenue
- South Edmonton Common
- Silver Berry
- MacEwan
- Ormsby Place
Here’s a rough look at some of the data on a map:

The top 5 neighbourhoods accounted for 19.1% of all the photos posted.
Final Thoughts
I hope you found this look at Instagram usage in Edmonton useful! Remember, this is not meant to quantify usage, but rather is intended to give you a sense of the way Instagram is used throughout our city. Obviously it would be interesting to analyze what exactly is being posted on Instagram, but that kind of analysis is much more complicated.
Happy Instagramming!
-
It would be more accurate to say this is a look at photos posted in Edmonton. To gather the data, I asked the Instagram API for photos posted within the limits of the City of Edmonton. While most of those were likely posted by residents, some would have been from tourists or other visitors. ↩
