State of the Edmonton Twittersphere 2013: Top Users & Tools

In case you missed it, check out the overview post for a general look at Twitter in Edmonton in 2013. In this entry I’ll share more details on who the most active, replied to, and retweeted users of the year were. If you want to see the most followed users in Edmonton, check out Twopcharts. Taylor Hall is the first local user over 300,000 followers!

A quick reminder that the data in this post comes from a sample of roughly 13.8 million tweets posted by local users as defined in the overview post. Nearly 120,000 local users posted at least one tweet in 2013.

Here are the 25 most active local users (they tweeted more than anyone else):

  1. RPrasad619
  2. DaniParadis
  3. KikkiPlanet
  4. DavidPapp
  5. canadianglen
  6. Leask
  7. TrevorBoller
  8. YEGlifer
  9. JovanHeer
  10. abdihalimsalad
  11. MyLegacyCoach
  12. HouseofGlib
  13. ChristySpratlin
  14. bcbreakaway
  15. markyeg
  16. Moesquare
  17. edmontonjournal
  18. 1023nowradio
  19. machinegunv
  20. DJ_Orphan
  21. Gloriadantuono
  22. tommylutz
  23. eissyrC
  24. ctvedmonton
  25. candyTae

There were three easily-identifed bots that would have been in the list above:

  1. edmonton_rt
  2. EdmontonCP
  3. HOT107OD

Here are the 25 most active local users using #yeg (they tweeted using the #yeg hashtag more than anyone else):

  1. ctvedmonton
  2. GlobalEdmonton
  3. CBCEdmonton
  4. iNews880
  5. 925FreshFM
  6. mybirdietweets
  7. edmontonjournal
  8. 1049VirginYEG
  9. DerrickDodgeYeg
  10. metroedmonton
  11. RobWilliamsCTV
  12. KikkiPlanet
  13. Dave_CHED
  14. Edmontonsun
  15. Yegfit
  16. YEGFoodie
  17. vineshpratap
  18. EJ_Arts
  19. JBH8
  20. lindork
  21. lite957
  22. DishcrawlYEG
  23. Sperounes
  24. 1023nowradio
  25. YEGlifer

There were four bots that tweeted enough to be in that list above:

  1. edmonton_rt
  2. EdmCA
  3. everythingyeg
  4. yegtraffic

Here are the 25 most replied to local users (other local users had lots of conversations with these users):

  1. KikkiPlanet
  2. EdmontonOilers
  3. JasonGregor
  4. nielsonTSN1260
  5. YEGlifer
  6. Leask
  7. TrevorBoller
  8. CommonSenseSoc
  9. JenBanksYEG
  10. eissyrC
  11. Wildsau
  12. DeeMented2
  13. Kage_99
  14. britl
  15. JameyMPhoto
  16. erinklassen
  17. dantencer
  18. lindork
  19. dstaples
  20. baconhound
  21. Steeeveohh
  22. joshclassenCTV
  23. JackieDee16
  24. Arbitral
  25. edmontonjournal

Here are the 25 most retweeted non-individual local users:

  1. edmontonjournal
  2. ctvedmonton
  3. globaledmonton
  4. cityofedmonton
  5. cbcedmonton
  6. edmontonoilers
  7. yegsphere
  8. yegtraffic
  9. localgoodyeg
  10. oilersnation
  11. edmoilkings
  12. edmontonpolice
  13. yegtweetup
  14. metroedmonton
  15. whereedmonton
  16. edmontonsun
  17. ualberta
  18. 925freshfm
  19. cisncountry
  20. inews880
  21. cfl_esks
  22. 1049virginyeg
  23. northlands
  24. nait
  25. oldstrathcona

Here are the 25 most retweeted individual local users:

  1. kikkiplanet
  2. dantencer
  3. jasongregor
  4. joshclassenctv
  5. fakeoilersgm
  6. paulatics
  7. doniveson
  8. mastermaq
  9. cstpower
  10. nielsonTSN1260
  11. sunterryjones
  12. sbarsbyweather
  13. wanyegretz
  14. etownmickey
  15. ryanjespersen
  16. britl
  17. davecournoyer
  18. lindork
  19. trevorboller
  20. dstaples
  21. ebs_14
  22. robin_brownlee
  23. yeglifer
  24. staceybrotzel
  25. geneprincipe

Clearly if you tweet about the Oilers, there’s a good chance you’re going to get retweeted. I’m fascinated by the fact that a satirical account, @FakeOilersGM, is the fifth most retweeted individual. Shows you what kind of year the Oilers have had, and how engaged Edmontonians are with the Oilers.

Only the Edmonton Journal was retweeted more than 10,000 times. A total of 88 users were retweeted more than 1000 times, 1547 users were retweeted more than 100 times, and nearly 11,000 users were retweeted at least 10 times.

Tools

The ten most popular tools or clients used to tweet in 2013 accounted for 84% of all local tweets. The top 25 accounted for just less than 93% of all tweets. There’s definitely a long tail here though, as more than 3300 different clients were used.

  1. Twitter for iPhone
  2. web
  3. Twitter for Android
  4. Twitter for BlackBerry®
  5. TweetDeck
  6. Twitter for iPad
  7. HootSuite
  8. Facebook
  9. Instagram
  10. Tweet Button

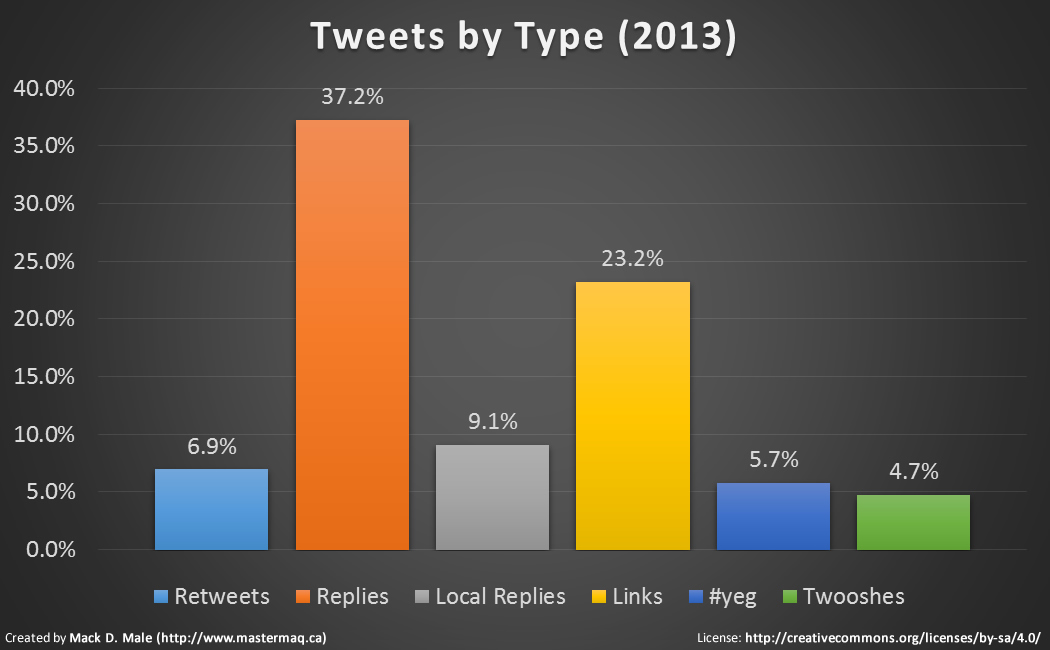
Here’s a look at the breakdown:

Tweets by Client (2013)

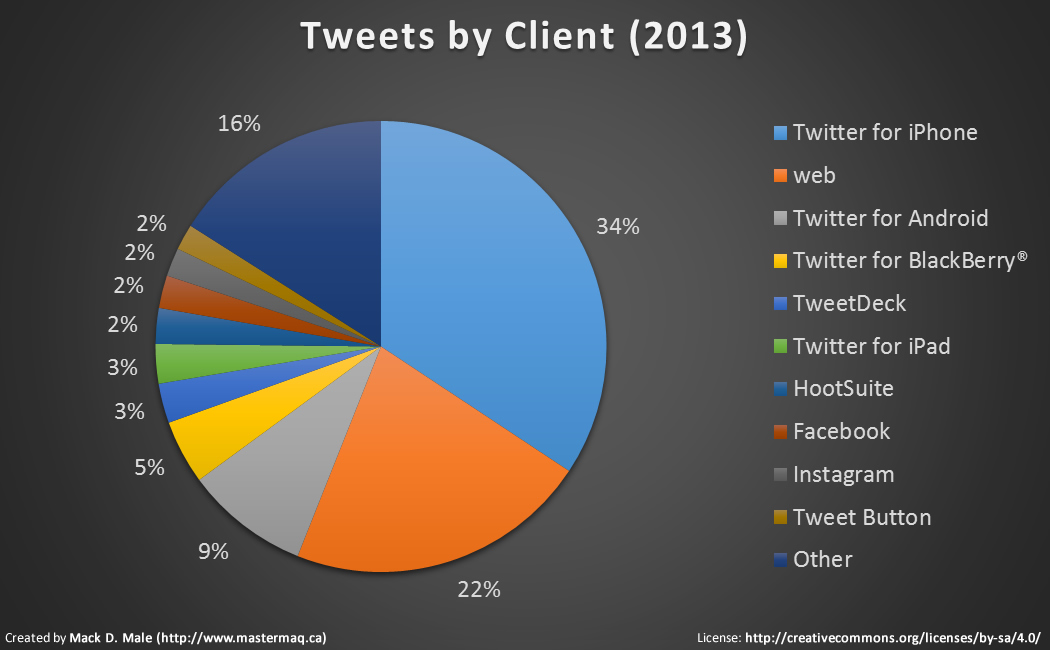
No surprise to see BlackBerry fall down below Android, but I must admit I am a little surprised it remains so high on the list.

You can see the top users & tools from previous years here: 2012, 2011, 2010, 2009.

Happy Tweeting!

State of the Edmonton Twittersphere 2013: Overview

Welcome to the State of the Edmonton Twittersphere for 2013, my fifth look at the intersection of Twitter and Edmonton. You can see my previous annual recaps here: 2012, 2011, 2010, 2009.

In previous years, I have more or less treated the reports as connected to one another. I’d capture nearly every tweet posted by local users over the year, and compare the data to previous years, and you’d see the growth. This year is different. Twitter made changes to the part of its system that I use to gather the data, so instead of gathering most of the data, I instead was only able to gather a large sample.

The sample for this year’s report is about 13.8 million tweets posted by local users. Local users are defined the same way as before: if a user has his or her location set to Edmonton, St. Albert, Sherwood Park, Leduc, Nisku, Stony Plain, Fort Saskatchewan, Beaumont, Spruce Grove, or matching lat/long coordinates, they are considered an Edmontonian, and thus a “local user”.

Of the 13.8 million tweets in this year’s sample:

  • Just under 800,000 or 5.7% were tagged #yeg.
  • More than 950,000 or 6.9% were retweets.
  • About 5.1 million or 37.2% were replies.
  • Roughly 1.2 million or 9.1% were replies to other local users.
  • Nearly 3.2 million or 23.2% contained links.
  • More than 640,000 or 4.7% were twooshes (exactly 140 characters).

Tweets by Type (2013)

In 2013, the day of the week with most tweets posted was Wednesday, which is consistent with previous years. Sunday and Saturday saw the fewest tweets posted.

Tweets by Type (2013)

Local users used over 840,000 different hashtags in 2013. As usual, hashtags ranged in length from 1 character to 139, excluding the hash, and they were used for just about every purpose you can think of. The average hashtag length was 13 characters.

Here are the top 25 hashtags used by local users in 2013:

  1. #yeg
  2. #oilers
  3. #edmonton
  4. #yegfood
  5. #yegvote
  6. #ableg
  7. #cdnpoli
  8. #yyc
  9. #shpk
  10. #yegwx
  11. #jobs
  12. #yegcc
  13. #nhl
  14. #ff
  15. #yegtraffic
  16. #stalbert
  17. #yegdt
  18. #ualberta
  19. #yegarts
  20. #cbc
  21. #yegweather
  22. #whatshouldplaynext
  23. #teamfollowback
  24. #instantfollowback
  25. #canada

Here’s a visualization of the top 100 hashtags excluding #yeg:

Top Hashtags for 2013

It’s no surprise that #yeg was once again the most popular hashtag, by far. Twitter even declared #yeg as the second most popular trend in Canada for the year. In total, there were 4,611 different hashtags starting with #yeg used by local users in 2013.

Here are the top 25 #yeg-related hashtags:

  1. #yeg
  2. #yegfood
  3. #yegvote
  4. #yegwx
  5. #yegcc
  6. #yegtraffic
  7. #yegdt
  8. #yegarts
  9. #yegweather
  10. #yegarena
  11. #yegmusic
  12. #yegjobs
  13. #yegbike
  14. #yegre
  15. #yegevents
  16. #yegfashion
  17. #yegbiz
  18. #yegfringe
  19. #yegtheatre
  20. #yegtransit
  21. #yegfilm
  22. #yegmedia
  23. #yegpkn
  24. #yegbeer
  25. #yegsa

Here’s a visualization of the top 100 #yeg-related hashtags:

Top #yeg Hashtags for 2013

No surprise that #yegfood remained on top (after #yeg of course) and I suppose it shouldn’t be surprising that in an election year, #yegvote was quite popular. Interesting to me that #yegjobs is so high, but I suppose that could be due to bots or automated tweets.

I’ll have additional data to share in my next post, which will include the most active, replied to, and retweeted users of the year.

Happy Tweeting!

State of the Edmonton Twittersphere 2012 – Hashtags & Links

This is the third part in my State of the Edmonton Twittersphere for 2012 – you can read the overview post here (and here is the hashtags & links entry for 2011). As we saw in that entry, local users posted more than 4 million tweets containing links. They also posted nearly 5 million tweets containing hashtags. Let’s take a closer look at what exactly we tweeted about in 2012.

It’s difficult to extract a lot value out of links because everything is trapped behind the t.co wrapper, but I did want to highlight the time of day that links seem to be posted. Recall that the hourly peak for tweet volume in general comes at around 9 PM, whereas for tweets containing links the peak is 11 AM.

Local users used just over 1 million different hashtags in 2012, up from nearly 600,000 in 2011. Hashtags ranged in length from 1 character to 139, excluding the hash, and they were used for just about every purpose you can think of. The average hashtag length was 14 characters.

Here are the top 25 hashtags used by local users in 2012:

  1. #yeg
  2. #ableg
  3. #yegfood
  4. #oilers
  5. #abvote
  6. #edmonton
  7. #ff
  8. #cdnpoli
  9. #yyc
  10. #yegwx
  11. #jobs
  12. #wrp
  13. #nhl
  14. #yegarts
  15. #ualberta
  16. #shpk
  17. #yegtraffic
  18. #yegweather
  19. #yegcc
  20. #yegdt
  21. #yegmusic
  22. #cbc
  23. #stalbert
  24. #yegarena
  25. #fb

Here’s a visualization of the top 100 hashtags excluding #yeg:

The most popular hashtag of all is still #yeg by a long shot. It was used about 660,000 times by local users which works out to 13.4% of all local tweets containing hashtags. The list above also illustrates the prevalence of #yeg-related hashtags. In 2012, local users used more than 4200 of them, up from 3600 last year. Though half of them were used just once, 44 #yeg-related hashtags were used more than 1000 times each.

Here are the top 25 #yeg-related hashtags:

  1. #yegfood
  2. #yegwx
  3. #yegarts
  4. #yegtraffic
  5. #yegweather
  6. #yegcc
  7. #yegdt
  8. #yegmusic
  9. #yegarena
  10. #yegre
  11. #yegjobs
  12. #yegwxfx
  13. #yegtransit
  14. #yegfringe
  15. #yegtheatre
  16. #yegfoodag
  17. #yegctvml
  18. #yegfilm
  19. #yegbike
  20. #yegfashion
  21. #yegmedia
  22. #yegbeer
  23. #yegpets
  24. #yeggeek
  25. #yegwine

Here’s a visualization of the top 100 #yeg-related hashtags:

I noticed some trends looking at the top 100 hashtags, so I decided to group some tags into topics or categories. I came up with nine that stood out:

  • Arts – #yegarts, #yegfringe, #yegmusic, #yegtheatre, #yegfilm
  • Downtown – #yegdt, #yegarena
  • Education – #abed, #edtech, #ualberta, #epsb
  • Food – #yegfood, #yegfoodag
  • Politics – #yegcc, #ableg, #cdnpoli, #abpoli, #yegfed
  • Regions – #shpk, #sprucegrove, #stalbert, #fortsask, #strathco, #leduc
  • Sports –#oilers, #nhl, #esks, #cfl, #oilkings
  • Transportation – #yegtraffic, #yegtransit, #yegbike
  • Weather – #yegweather, #yegwx, #yegwxfx

Here’s a breakdown of how those categories relate to one another. You can see that we tweet more about politics and sports than arts and education:

Here’s a look at the frequency of each category over the course of the year. This starts to show some interesting variations over the year, most notably in the summer when we experience our nicest weather and the Fringe Festival is taking place:

And here’s that same frequency but highlighting the spikes that took place throughout the year:

I’d love to hear your ideas for what those spikes represent, but here are my guesses for a few of them:

  • Sports – April 10, 2012 – This was the day the Oilers won the lottery for the first overall draft pick.
  • Education – June 15, 2012 – This was the day of the HUB Mall shooting.
  • Sports – June 22, 2012 – This was the day the Oilers selected Nail Yakupov first overall at the 2012 NHL Entry Draft.
  • Arts – August 17, 2012 – This was the day after the Fringe started and was the day of the Metallica concert.
  • Downtown – October 17, 2012 – This was the day of the Downtown Arena update (Mandel’s deadline for the Katz Group).
  • Food – October 26, 2012 – This was the day of the public hearing on the Food & Agriculture Strategy.
  • Transportation/Weather – November 7, 2012 – This was the day of our first major snowfall.
  • Politics – December 12, 2012 – This was the day Council voted to re-open negotiations with the Katz Group on the arena.

You might be wondering about the provincial election that took place in April. Well I originally included #abvote in the Politics category, but it skewed the results so dramatically I took it out. Here’s what it the year looks like if you include #abvote:

April 23 was election day, and local users posted more tweets on that day than any other until the snowstorm came along and on November 6 and 7. In addition to those two days, just one other day in 2012 had more tweets than election day and that was December 12 when Council last discussed the arena.

This entry brings my 2012 report to a close. I hope you found it useful – thanks for reading!

2012 in Review

  1. Overview
  2. Users & Clients
  3. Hashtags & Links

State of the Calgary Twittersphere – Hashtags & Links

This is the third part in my State of the Calgary Twittersphere for 2012 – you can read the overview post here. As we saw in that entry, local users posted more than 5 million tweets containing links. They also posted about 5 million tweets containing hashtags. Let’s take a closer look at what exactly they tweeted about in 2012.

It’s difficult to extract a lot value out of links because everything is trapped behind the t.co wrapper, but I did want to highlight the time of day that links seem to be posted. Recall that the hourly peak for tweet volume in general comes at around 9 PM, whereas for tweets containing links the peak is 11 AM.

Local users used about 1.1 million different hashtags in 2012. Hashtags ranged in length from 1 character to 139, excluding the hash, and they were used for just about every purpose you can think of. The average hashtag length was 14 characters.

Here are the top 25 hashtags used by local users in 2012:

  1. #yyc
  2. #calgary
  3. #abvote
  4. #jobs
  5. #flames
  6. #ableg
  7. #ff
  8. #cdnpoli
  9. #porn
  10. #xxx
  11. #yeg
  12. #job
  13. #stampede100
  14. #wrp
  15. #rent
  16. #yyccc
  17. #win
  18. #oilrigjobs
  19. #nhl
  20. #love
  21. #yycre
  22. #cfl
  23. #canada
  24. #sceneyyc
  25. #giveaway

Here’s a visualization of the top 100 hashtags excluding #yyc:

The most popular hashtag of all is still #yyc, followed by #calgary (#yyc is about 6 times more popular than #calgary). In total, #yyc was used about 600,000 times by local users which works out to 11.9% of all local tweets containing hashtags.

Though not as prevalent in the top 100, local users did use #yyc-related hashtags quite frequently. In total, about 2500 different hashtags were used that start with #yyc. A little more than half of those were used just once, and just 22 were used 1000 times or more.

Here are the top 25 #yyc-related hashtags:

  1. #yyccc
  2. #yycre
  3. #yycbike
  4. #yyccentre
  5. #yyctraffic
  6. #yycfood
  7. #yycarts
  8. #yyctransit
  9. #yycbe
  10. #yycplan
  11. #yycfoodtrucks
  12. #yycscan
  13. #yycjobs
  14. #yycmusic
  15. #yycse
  16. #yycweather
  17. #yycsocent
  18. #yycpkn
  19. #yyceats
  20. #yycfashion
  21. #yycsw
  22. #yycnw
  23. #yyccrime
  24. #yycfilm
  25. #yycklein

Here’s a visualization of the top 100 #yyc-related hashtags:

This entry brings my 2012 report to a close. I hope you found it useful – thanks for reading!

2012 in Review

  1. Overview
  2. Users & Clients
  3. Hashtags & Links

State of the Edmonton Twittersphere 2012 – Users & Clients

This is the second part in my State of the Edmonton Twittersphere for 2012 – you can read the overview post here (and here is the users & clients post for 2011). As we saw in that entry, more than 105,000 local users posted at least one tweet in 2012. Let’s take a closer look at users and the tools they used to post tweets.

While a large number of users posted at least one tweet throughout the year, there are fewer users who post something in any given month. Keeping in mind that November is underrepresented in this chart, we can see that October had the most active users at nearly 52,000, and the trend is very clearly going up.

Again I think it is really interesting to look at this data over the longer term. Here’s a look at the growth in monthly active users since I started tracking data in 2009:

There are a small number of really active users, and a much larger number of less active users. In 2012, the top 100 most active users accounted for about 1.5 million or 8.8% of all local tweets (that’s down from 16% in 2011).

Here are the 25 most active users:

  1. MadMissee
  2. KikkiPlanet
  3. theleanover
  4. rootnl2k
  5. JameyMPhoto
  6. JovanHeer
  7. markyeg
  8. TrevorBoller
  9. Klayoven
  10. CommonSenseSoc
  11. prabhjots5
  12. Leask
  13. canadianglen
  14. edmontonjournal
  15. Walleedj
  16. PetitMonstre77
  17. alannafletcher
  18. AskMartyMisner
  19. ZoomJer
  20. MandaTRT
  21. jmschow
  22. DerrickDodgeYeg
  23. Pokerclack
  24. YEGlifer
  25. scottyos

Here are the 5 most active bots or automated feeds:

  1. EdmontonBizcaf
  2. GCAccess
  3. yegtraffic
  4. EdmCa
  5. yegwx

Combined, the top 30 users accounted for about 4.6% of all local tweets (down from 8.3% last year).

Here are the 25 most active users using #yeg:

  1. ctvedmonton
  2. DerrickDodgeYeg
  3. CBCEdmonton
  4. iNews880
  5. metroedmonton
  6. Edmontonsun
  7. edmontonjournal
  8. JBH8
  9. 1049VirginYEG
  10. RobWilliamsCTV
  11. GlobalEdmonton
  12. JOEFM
  13. lindork
  14. MaddCashFS
  15. 1023nowradio
  16. BTEdmonton
  17. OFSS1969
  18. SpontainRichFS
  19. TrevorBoller
  20. oldstrathcona
  21. KikkiPlanet
  22. EJ_Arts
  23. DebraWard
  24. artrubicon
  25. CommonSenseSoc

Here are the 5 most active bots or automated feeds using #yeg:

  1. EdmCa
  2. yegwx
  3. yegsphere
  4. yegtraffic
  5. hiresuccessjobs

The top 100 most active users using #yeg and related tags accounted for 1.4% of all local tweets, and 25.8% of all #yeg-tagged tweets, down from 30.3% last year.

Here are the 25 most replied to users (by other local users):

  1. KikkiPlanet
  2. JenBanksYEG
  3. JasonGregor
  4. nielson1260
  5. JameyMPhoto
  6. ZoomJer
  7. TrevorBoller
  8. Leask
  9. CommonSenseSoc
  10. britl
  11. YEGlifer
  12. Pokerclack
  13. Wildsau
  14. EdmontonOilers
  15. baconhound
  16. Luzzara
  17. BigAddie
  18. theleanover
  19. dantencer
  20. CopperTopper_85
  21. dstaples
  22. bananaramafoFin
  23. lindork
  24. Kristinnuendo
  25. amvanimere

Those 25 users accounted for 8.3% of all local replies, down from 11.2% last year. The top 100 most replied to local users accounted for 2.7% of all local tweets and 18.7% of all local replies (compared to 24.5% last year).

I think the retweet is one of the most valuable metrics on Twitter. Anyone can post a lot, or gain a lot of followers, but to get retweeted by lots of other people you need to be useful/interesting/funny/inspiring/etc. In the past I have just produced one list of the most retweeted users, but this year I decided to separate individuals from organizations.

Here are the 25 most retweeted non-individual users:

  1. edmontonjournal
  2. ctvedmonton
  3. EdmontonOilers
  4. metroedmonton
  5. CBCEdmonton
  6. GlobalEdmonton
  7. yegtraffic
  8. CityofEdmonton
  9. EdmOilKings
  10. Edmontonsun
  11. edmontonpolice
  12. HopeMission
  13. UAlberta
  14. EdmontonHumane
  15. iNews880
  16. CISNCountry
  17. AvenueEdmonton
  18. cfl_esks
  19. EJ_Extra
  20. oldstrathcona
  21. BlitzEdmonton
  22. TBSonK97
  23. sonic1029
  24. DerrickDodgeYeg
  25. FlyEIA

Here are the 25 most retweeted individual users:

  1. KikkiPlanet
  2. Paulatics
  3. mastermaq
  4. dantencer
  5. JasonGregor
  6. hallsy04
  7. joshclassenCTV
  8. CstPower
  9. ryanjespersen
  10. dstaples
  11. britl
  12. davecournoyer
  13. TrevorBoller
  14. lindork
  15. VassyKapelos
  16. sunterryjones
  17. ebs_14
  18. SBarsbyweather
  19. ChrisTse_
  20. nielson1260
  21. Wildsau
  22. GenePrincipe
  23. JameyMPhoto
  24. etownmickey
  25. bingofuel

A total of 59 users were retweeted by other local users 1000 times or more. Just 7 users were retweeted more than 5000 times, and @KikkiPlanet was the only individual in that group. Just like last year, only @EdmontonJournal was retweeted more than 10,000 times.

I did not keep track of the most followed users this year, primarily because the information is readily available elsewhere. If you want to know who the most followed users in Edmonton are, check out Twopcharts.

Clients

More than 3800 different applications and services were used to post tweets in 2012, up slightly from more than 3100 last year. For the first time since I have been tracking stats, the web is no longer the top dog! Here are the top ten:

  1. Twitter for iPhone
  2. web
  3. Twitter for BlackBerry®
  4. Twitter for Android
  5. TweetDeck
  6. HootSuite
  7. Instagram
  8. Facebook
  9. Tweet Button
  10. Echofon

The top ten clients accounted for 82.9% of all local tweets posted in 2012 (compared to 76.8% last year).

Coming Up

  1. Overview
  2. Users & Clients
  3. Hashtags & Links

State of the Calgary Twittersphere 2012 – Users & Clients

This is the second part in my State of the Calgary Twittersphere for 2012 – you can read the overview post here. As we saw in that entry, more than 105,000 local users posted at least one tweet in 2012. Let’s take a closer look at users and the tools they used to post tweets.

While a large number of users posted at least one tweet throughout the year, there are fewer users who post something in any given month. Keeping in mind that November is underrepresented in this chart, we can see that October had the most active users at nearly 60,000, and the trend is very clearly going up.

There are a small number of really active users, and a much larger number of less active users. In 2012, the top 100 most active users accounted for about 1.7 million or 9.0% of all local tweets.

Here are the 25 most active users:

  1. izzynobre
  2. GeekyLyndsay
  3. twiggy_hot
  4. xoTalim
  5. GeneralTekno
  6. BradWardLive
  7. SarahMcGuireJB
  8. WestJet
  9. TK0N
  10. dead__last
  11. CameraguyRob
  12. longdoglover
  13. RebTheCatSitter
  14. MusicMunchkin
  15. misskatsuragi
  16. a_picazo
  17. YorchCalgarian
  18. annemaccat
  19. TonyCosens
  20. lisawest99
  21. Paradise5551
  22. Wavefronttech
  23. candacemountain
  24. monaSinging
  25. PrimeBane

Here are the 5 most active bots or automated feeds:

  1. Remodelit_RADIO
  2. CalgaryBizcaf
  3. econewsbits
  4. HeraldHeadlines
  5. righelp

Combined, the top 30 users accounted for about 5.1% of all local tweets.

Here are the 25 most active users using #yyc:

  1. annemaccat
  2. ciawesome
  3. CTVCalgary
  4. CalgaryCommute
  5. metrocalgary
  6. calgaryherald
  7. BikeBikeYYC
  8. redgypsee
  9. OpenFileCGY
  10. 660NewsTraffic
  11. CTVMorningYYC
  12. ireneerutema
  13. markusoff
  14. LisaOstrikoff
  15. CalgaryREMAX
  16. 660News
  17. cityofcalgary
  18. knoppolis
  19. GlobalCalgary
  20. daxjustin
  21. collenbe
  22. LoGoDNB
  23. zoeywrites
  24. kahanelaw
  25. VogueCalgary

Here are the 5 most active bots or automated feeds using #yyc:

  1. CgyCa
  2. DailyDealsCGY
  3. mk_it_solutions
  4. Calgary_News
  5. BestDealCalgary

The top 100 most active users using #yyc and related tags accounted for less than 1.0% of all local tweets, and 24.8% of all #yyc-tagged tweets.

Here are the 25 most replied to users (by other local users):

  1. nenshi
  2. calgarytransit
  3. X929
  4. Fan960Steinberg
  5. antipretty_yyc
  6. lonnietaylor
  7. NHLFlames
  8. Eves1
  9. danellew
  10. Diegirl
  11. lubeyisms
  12. annemaccat
  13. maniacalmom
  14. CassieNeil
  15. DarciBrianne
  16. MisterYYC
  17. myownbiggestfan
  18. dinnerwithjulie
  19. buzzbishop
  20. WestJet
  21. WeebDaCat
  22. lisawest99
  23. doglover100
  24. redgypsee
  25. fan960walker

Those 25 users accounted for 7.2% of all local replies. The top 100 most replied to local users accounted for 1.5% of all local tweets and 15.2% of all local replies.

I think the retweet is one of the most valuable metrics on Twitter. Anyone can post a lot, or gain a lot of followers, but to get retweeted by lots of other people you need to be useful/interesting/funny/inspiring/etc.

Here are the 25 most retweeted non-individual users:

  1. calgaryherald
  2. CBCCalgary
  3. CTVCalgary
  4. metrocalgary
  5. cityofcalgary
  6. NHLFlames
  7. 660News
  8. GlobalCalgary
  9. AvenueMagazine
  10. ciawesome
  11. calgarysun
  12. calstampeders
  13. calgarytransit
  14. CalgaryPoker
  15. X929
  16. WestJet
  17. VolunteerCal
  18. calgarypolice
  19. calgarystampede
  20. downtowncalgary
  21. OpenFileCGY
  22. CTVMorningYYC
  23. calgary
  24. Calgary_News
  25. BikeBikeYYC

Here are the 25 most retweeted individual users:

  1. nenshi
  2. markusoff
  3. buzzbishop
  4. mikesbloggity
  5. ericfrancis
  6. DonBraid
  7. MisterYYC
  8. lonnietaylor
  9. Crackmacs
  10. dansgoodside
  11. LisaOstrikoff
  12. dinnerwithjulie
  13. TheoFleury14
  14. codyincalgary
  15. espyexperience
  16. ctvtoddgallant
  17. Fan960Steinberg
  18. sunrickbell
  19. CoryBMorgan
  20. paul_dunphy
  21. daxjustin
  22. socialgrrrl
  23. jayemkayem
  24. theturner
  25. a_picazo

A total of 44 users were retweeted by other local users 1000 times or more. Just 5 users were retweeted more than 5000 times, and @nenshi was the only individual in that group. Just @calgaryherald was retweeted more than 10,000 times.

I did not keep track of the most followed users this year, primarily because the information is readily available elsewhere. If you want to know who the most followed users in Calgary are, check out Twopcharts.

Clients

More than 4200 different applications and services were used to post tweets in 2012. For the first time since I have been tracking stats, the web is no longer the top dog! Here are the top ten:

  1. Twitter for iPhone
  2. web
  3. Twitter for BlackBerry®
  4. Twitter for Android
  5. TweetDeck
  6. HootSuite
  7. Instagram
  8. Facebook
  9. Tweet Button
  10. Echofon

The top ten clients accounted for 81.1% of all local tweets posted in 2012.

Coming Up

  1. Overview
  2. Users & Clients
  3. Hashtags & Links

State of the Edmonton Twittersphere 2012 – Overview

Welcome to the State of the Edmonton Twittersphere for 2012, my look at the intersection of Twitter and Edmonton in 2012. You can see my previous annual recaps here: 2011, 2010, 2009.

I’ve done my best to ensure all of the data in this report is accurate, but I make no guarantees – use it at your own risk. The data comes from the Twitter API, and was collected over the course of 2012. If a user has his or her location set to Edmonton, St. Albert, Sherwood Park, Leduc, Nisku, Stony Plain, Fort Saskatchewan, Beaumont, Spruce Grove, or matching lat/long coordinates, they are considered an Edmontonian, and thus a “local user”.

Please treat the numbers in this report as a minimum. There are instances where I wasn’t able to capture all of the data, and there are certainly users here in Edmonton who do not match the above definition of a “local user”. More important than the raw numbers themselves are the trends, and that’s why in many cases I have presented rounded rather than exact figures. You can click on any graph to see a larger version.

Here are the highlights for 2012:

  • More than 105,000 local users posted at least one tweet.
  • About 17 million tweets were posted by local users, which works out to 32.3 tweets per minute (up from 11.2 million tweets and 21.4 tweets per minute last year).
  • Here’s a breakdown of those tweets:
    • Nearly 900,000 tweets were tagged #yeg or a related hashtag (5.3%, down from 6.4% last year)
    • More than 850,000 tweets were retweets (5.1%, down from 6.2% last year)
    • About 6.5 million tweets were replies (38.8%, down from 39.4% last year)
    • Just under 2.4 million tweets were replies to other local users (14.2%, down from 15.2% last year)
    • About 4 million tweets contained links (23.3%, down from 22.9% last year)
    • Nearly 5 million tweets contained hashtags (28.9%)
    • More than 400,000 tweets were twooshes (a twoosh is exactly 140 characters) (2.5%, down from 2.9% last year)

When the year started, Edmontonians were posting about 1.2 million tweets per month. While the growth over the course of the year was less dramatic than in years past, the trend was clearly up. Please note that November shows a dip but that was due to issues with my system, and does not reflect a sudden drop in activity. October was the busiest month we’ve had in terms of tweet volume, with a little over 1.7 million tweets posted.

The day with the most tweets posted was November 7. A quick scan of the headlines shows that was the day of our major snowfall that caused all kinds of issues for Edmontonians, and clearly they took to Twitter to talk about it. A little over 50 tweets per minute were posted that day, and the number of local replies to one another was twice the average.

Roughly 47.5% of all local tweets were posted between the hours of 9 AM and 6 PM, which is down a little from 49.1% last year. The fewest tweets are posted around 4 AM, and the peak comes at around 9 PM.

Looking at days of the week, it turns out that Wednesday had the most tweets posted followed closely by Tuesday, with Monday being having the fewest. This is more or less the same as last year, when Wednesday was also the highest and Sunday was the lowest.

Looking at the stats by year is great, but it is the longer-term view that is most interesting. Here’s a look at the number of tweets posted per month since I started tracking back at the beginning of 2009:

When I built my tracking system at the end of 2008 there were very few users and very few tweets being posted each month. I have maintained and improved it over the last few years, and thankfully Twitter’s API has become incredibly stable. But the original design/approach has reached some limits. So with that in mind, I built a new system over the holidays that I will soon be launching at ShareEdmonton so that you can see this information in near real-time. It may not be as complete initially, but I will improve it over the course of the year. Stay tuned!

Coming Up

In order to make it easier to produce and consume this report, I have decided to break it into sections. This entry provided an overview, and upcoming entries will focus on different aspects of Twitter usage in Edmonton:

  1. Overview
  2. Users & Clients
  3. Hashtags & Links

If you have any questions about this information, please leave a comment below!

State of the Calgary Twittersphere 2012 – Overview

Welcome to the State of the Calgary Twittersphere for 2012, my look at the intersection of Twitter and Calgary in 2012. While I have kept up with the stats for Edmonton, I haven’t posted anything about Calgary since my last monthly post way back in September of 2010. That post looked at the statistics for July 2010, when just 10,500 local users posted a tweet. Twitter has grown significantly since then, and so has the community in Calgary.

I’ve done my best to ensure all of the data in this report is accurate, but I make no guarantees – use it at your own risk. The data comes from the Twitter API, and was collected over the course of 2012. If a user has his or her location set to Calgary, Airdrie, Okotoks, Cochrane, Strathmore, or matching lat/long coordinates, they are considered a Calgarian, and thus a “local” user.

Please treat the numbers in this report as a minimum. There are instances where I wasn’t able to capture all of the data, and there are certainly users here in Calgary who do not match the above definition of a “local user”. More important than the raw numbers themselves are the trends, and that’s why in many cases I have presented rounded rather than exact figures. You can click on any graph to see a larger version.

Here are the highlights for 2012:

  • More than 105,000 local users posted at least one tweet.
  • More than 19 million tweets were posted by local users, which works out to 36.6 tweets per minute.
  • Here’s a breakdown of those tweets:
    • Nearly 700,000 tweets were tagged #yyc (3.6%)
    • Just over 900,000 tweets were retweets (4.7%)
    • Almost 7 million tweets were replies (35.5%)
    • Almost 2 million tweets were replies to other local users (9.9%)
    • More than 5 million tweets contained links (26.2%)
    • More than 5.1 million tweets contained hashtags (26.6%)
    • More than 400,000 tweets were twooshes (a twoosh is exactly 140 characters) (2.3%)

When the year started, Calgarians were posting about 1.5 million tweets per month. That number remained relatively constant throughout the year, though there was a big jump in October to more than 1.8 million (and November appears lower than it should in this report due to issues with the data collection).

Roughly 47.8% of all local tweets in 2012 were posted between the hours of 9 AM and 6 PM. The fewest tweets were posted at about 4 AM, and there’s a visible spike in volume at around 9 PM.

Looking at days of the week, it turns out that Tuesday and Wednesday saw the most tweets posted, with Monday having the fewest (though there isn’t much of a difference compared to the rest of the week).

Though I have been recording stats for Calgary since 2009, I haven’t looked at the data in quite some time, so this was an interesting exercise. Comparing the data to last year’s report for Edmonton (and this year’s, which will be posted soon) gives you a sense of how much Twitter usage in Calgary has grown.

Coming Up

I have decided to break this report into sections to make it easier to produce and consume. This entry provided an overview, and upcoming entries will focus on different aspects of Twitter usage in Calgary:

  1. Overview
  2. Users & Clients
  3. Hashtags & Links

Thanks for reading!

State of the Edmonton Twittersphere 2011 – Hashtags & Links

This is the third part in my State of the Edmonton Twittersphere for 2011 – you can read the overview post here. As we saw in that entry, local users posted more than 2.5 million tweets containing links. They also posted more than 3 million tweets containing hashtags. Let’s take a closer look at what exactly we tweeted about in 2011.

Here’s a breakdown of the number of tweets posted per month containing links. As expected, it trends up:

More interesting than the number of links is what those links are for! Of course, most links are hidden behind shortened URLs using a service like TinyURL. That makes it difficult to see the final destination of the link. Additionally, Twitter rolled out its own URL shortener in August which automatically wrapped all links with t.co. So to get a sense of what the links look like, I examined the data from January through August and excluded any t.co wrapped links. That gives us this:

As you can see, bit.ly is by far the most popular URL shortening service. Looking at the top ten, we can see that Tumblr, Facebook, Foursquare, and YouTube account for a large number of the links we post on Twitter every day. So, we use Twitter to link to other social networking sites!

Here are the top ten domains (excluding t.co):

  1. bit.ly
  2. ow.ly
  3. tinyurl.com
  4. tumblr.com
  5. fb.me
  6. 4sq.com
  7. yfrog.com
  8. twitpic.com
  9. youtu.be
  10. edmjr.nl

Other popular domains included instagr.am, goo.gl, and dlvr.it.

Perhaps more useful than links for determining what we tweeted about are hashtags. After all, the hashtag was created as a way to “categorize” tweets. In 2011, local users posted more than 3 million tweets containing hashtags. The most commonly used hashtag, by a longshot, was #yeg. Here is a word cloud of the most commonly used hashtags:

Local users used nearly 600,000 different hashtags in 2011. The shortest was just one character, excluding the hash, and the longest was 139 characters. The average hashtag was 14 characters long. There were seven hashtags that filled the full 140 characters of a tweet (when you include the #) and all but one of them had to do with using a long hashtag (the outlier was an extended hey!).

This should give you a sense of the diversity of hashtags used, and also of the prevalence of #yeg:

Removing #yeg from the word cloud allows us to get a better sense of the other top tags:

Here are the top ten hashtags excluding #yeg:

  1. #oilers
  2. #ff
  3. #yegfood
  4. #edmonton
  5. #ableg
  6. #yyc
  7. #cdnpoli
  8. #alberta
  9. #customer
  10. #canada

The only one that surprises me there is #customer. I have no idea why that hashtag was so popular! Given that it hasn’t been used recently, I suspect a bot may have helped boost its use at some point throughout the year.

I have always been fascinated by the number of local “subtags” as I call them, or hashtags that start with #yeg. In 2011, local users posted more than 3600 different hashtags that started with #yeg. The average length, excluding the hash, was 11 characters. The longest was 52 characters. Appropriately, it was about the weather – #yegohmygoodnesscantbelievewinterisherehowwillimanage.

Here’s a look at the top #yeg-related hashtags:

Here are the top ten #yeg-related hashtags:

  1. #yegfood
  2. #yegarena
  3. #yegweather
  4. #yegwx
  5. #yegtraffic
  6. #yegcc
  7. #yegarts
  8. #yegmusic
  9. #yegfed
  10. #yegtransit

So what did we talk about on Twitter in 2011? The same stuff we talk about everywhere else – food, politics, music, traffic, etc. The list above is pretty similar to the list from 2010, with #yegfood on top and a number of political tags like #yegcc, #yegarena, and #yegfed.

Here’s another way to visualize how popular those ten hashtags were, when compared with all other #yeg-related tags:

And here’s a look at the next most commonly used tags after excluding the top ten:

I imagine #yegdt, #yegmedia, and #yegbiz will all climb the charts in 2012!

2011 in Review

This year I have broken the report into sections:

  1. Overview
  2. Users & Clients
  3. Hashtags & Links

This entry brings the report to a close. I hope you found it useful. Thanks for reading!

State of the Edmonton Twittersphere 2011 – Users & Clients

This is the second part in my State of the Edmonton Twittersphere for 2011 – you can read the overview post here. As we saw in that entry, more than 46,000 local users posted at least one tweet in 2011, and more than 23,000 were active in December. Let’s take a closer look at users and the tools they used to post tweets.

In my experience the creation date for a user is not always populated, but assuming it is incorrect or missing equally across the year, this chart gives us an indication of when local users signed up for accounts in 2011:

As you can see only March seems to stand out – the number of users created is otherwise fairly evenly distributed across the year.

On to the lists!

Here are the 25 most followed users:

  1. hallsy04
  2. bioware
  3. NHL_Oilers
  4. revtrev
  5. Pat_Lorna
  6. ebs_14
  7. masseffect
  8. dragonage
  9. randyfritz
  10. MilesSTEREOS
  11. askandimagine
  12. darklarke
  13. jayrahime
  14. DavidPapp
  15. AskMartyMisner
  16. DancinginLife
  17. mps_91
  18. TheMaddigans
  19. CityofEdmonton
  20. subunit1
  21. edmontonjournal
  22. redneckmommy
  23. ctvedmonton
  24. GenePrincipe
  25. ThisBirdsDay

The average local user has 138 followers (compared to 120 last year). A total of 918 users have 1000 followers or more (compared to 420 users last year).

Here are the 25 most listed users:

  1. bioware
  2. revtrev
  3. NHL_Oilers
  4. masseffect
  5. dragonage
  6. hallsy04
  7. redneckmommy
  8. rootnl2k
  9. randyfritz
  10. paradepro
  11. Pat_Lorna
  12. gcouros
  13. edmontonjournal
  14. gsiemens
  15. DancinginLife
  16. ebs_14
  17. da_buzz
  18. ctvedmonton
  19. CityofEdmonton
  20. dantencer
  21. CBCEdmonton
  22. mastermaq
  23. britl
  24. askandimagine
  25. GlobalEdmonton

The average local user has been listed 4 times (compared to 5 times last year).

Here are the 25 most active users:

  1. rootnl2k
  2. etownmelly
  3. theleanover
  4. JoThrillzPromo
  5. auryanna
  6. CommonSenseSoc
  7. KikkiPlanet
  8. RyanPMG
  9. Leask
  10. BikiniOrBust
  11. LiarAllDay
  12. ZoomJer
  13. fraygulrock
  14. counterplot
  15. JovanHeer
  16. PoisonLolita (now @Shannanicorn)
  17. SaySandra
  18. Jenn_Etown
  19. sarahbartlett (now @sarahesinfield)
  20. DV1NE
  21. gcouros
  22. AskMartyMisner
  23. andrew_leach
  24. TrevorBoller
  25. habanerogal

Here are the 5 most active bots:

  1. WCIJobs
  2. EdmontonBizcaf
  3. MadMissee
  4. yegtraffic
  5. LocalEdmonton

Combined those were the top 30 most active users, and they accounted for 8.3% of all local tweets. The top 100 most active users accounted for 16.0% of all local tweets (compared to 18.5% last year).

Here are the 25 most active users using #yeg (and #yeg-related hashtags):

  1. iNews880
  2. ctvedmonton
  3. edmontonjournal
  4. CBCEdmonton
  5. TamaraStecyk
  6. MacsTheWord
  7. Edmontonsun
  8. Paulatics
  9. DebraWard
  10. JBH8
  11. k97
  12. mastermaq
  13. Sirthinks
  14. SimonOstler
  15. KikkiPlanet
  16. CommonSenseSoc
  17. metroedmonton
  18. britl
  19. lindork
  20. thepolishviking
  21. Slummer90
  22. Macgyyver
  23. CityofEdmonton
  24. GigcityYEG
  25. craigpilgrim

Here are 5 most active bots using #yeg:

  1. yegsphere
  2. EdmCa
  3. yegwx
  4. yegtraffic
  5. Oilogosphere

The top 100 most active users using #yeg and related tags accounted for 30.3% of all #yeg-tagged tweets, down from 51.8% last year. That suggests that more users are using #yeg! A total of 14,238 users posted at least one tweet tagged with #yeg or a related tag in 2011.

Here are the 25 most replied to users (by other local users):

  1. KikkiPlanet
  2. JasonGregor
  3. confessionality
  4. ZoomJer
  5. JenBanksYEG
  6. Wildsau
  7. britl
  8. Pokerclack
  9. CommonSenseSoc
  10. dantencer
  11. SaySandra
  12. RockstarJodie
  13. TamaraStecyk
  14. Rainyfool
  15. Leask
  16. NoPantsAsh
  17. lindork
  18. Luzzara
  19. NHL_Oilers
  20. FeliciaDewar
  21. habanerogal
  22. TrevorBoller
  23. nielson1260
  24. Sirthinks
  25. MeghanDarker

Those 25 users accounted for 11.2% of all local replies. The top 100 most replied to local users accounted for 24.5% of all local replies (compared to 32.8% last year).

Here are the 25 most retweeted users (by other local users):

  1. edmontonjournal
  2. NHL_Oilers
  3. ctvedmonton
  4. dantencer
  5. CityofEdmonton
  6. mastermaq
  7. metroedmonton
  8. cbcedmonton
  9. Paulatics
  10. GlobalEdmonton
  11. SimonOstler
  12. yegtraffic
  13. JasonGregor
  14. britl
  15. KikkiPlanet
  16. edmontonsun
  17. sunterryjones
  18. EdmontonHumane
  19. GenePrincipe
  20. hallsy04
  21. iNews880
  22. joshclassen
  23. bingofuel
  24. Wildsau
  25. davecournoyer

If you ever needed proof that Edmonton is a hockey town, look no further than that list! A total of 38 users were retweeted by other local users 1000 times or more. Just the top 6 users were retweeted more than 4000 times, and just @edmontonjournal was retweeted more than 10,000 times.

I like to say that the “most retweeted” is the most important of all the lists in this post, because the retweet is the social currency of Twitter. If someone retweets you, that means that whatever you posted was important/clever/funny/inspiring/etc enough to share with others.

Clients

More than 3100 different applications and services were used to post tweets in 2011, up from more than 2000 last year. Here are the top ten:

  1. web
  2. Twitter for iPhone
  3. Twitter for BlackBerry®
  4. TweetDeck
  5. HootSuite
  6. Echofon
  7. twitterfeed
  8. Twitter for Android
  9. txt
  10. Tweet Button

The top ten clients accounted for 76.8% of all local tweets in 2011 (compared to 76.2% last year).

Coming Up

This year I have broken the report into sections:

  1. Overview
  2. Users & Clients
  3. Hashtags & Links

If you have suggestions for additional parts to the report, I’d love to hear them. Thanks for reading!