Exploring Calgary’s East Village

Sharon and I spent most of the long weekend down in Calgary, enjoying the beautiful weather and trying a bunch of new restaurants. A trip to our southern neighbour to eat has nearly become an annual tradition for us. This time we visited Cluck n Cleaver, Charbar, Shiki Menya, Pigeonhole, and returned to our favorite, Blue Star Diner. It was a great weekend!

Our visit to Charbar also gave us an excuse to explore the East Village once again, an area we last spent some time in back in 2014.

East Village

The East Village ARP notes that redevelopment of the area has “been a long-standing objective of the City of Calgary” and that the General Municipal Plan of 1979 encouraged residential development. From the ARP, here is the vision statement for the East Village:

“East Village will become a vibrant, humanly scaled and sustainable high density downtown neighborhood that respects and enhances its historical, physical and social context and reinforces a high quality of life for its diverse residents.”

The East Village area is 49 acres between Fort Calgary and the downtown and is where Calgary was founded. As development intensified elsewhere, the area was neglected for many years. But not anymore:

“Fast forward to today. East Village is in the midst of an exciting transformation. Since 2007, CMLC’s commitment of $357 million into infrastructure and development programs has so far attracted $2.4 billion of planned development expected to deliver $725 million of Community Revitalization Levy (CRL) for the City of Calgary, our sole shareholder. As developers and retailers have come to see the value of the East Village transformation, our available inventory of land has been snapped up. Today, just three parcels remain.”

You can see the current East Village ARP in PDF here. The City of Calgary is currently in the process of updating the East Village ARP, first approved in 2001 and last updated in 2010. That process has been underway for a couple of years now and is expected to wrap up later this year, with the draft available for public review this spring.

East Village

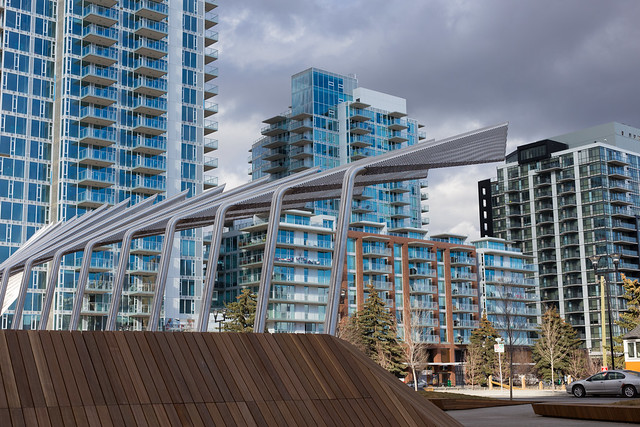
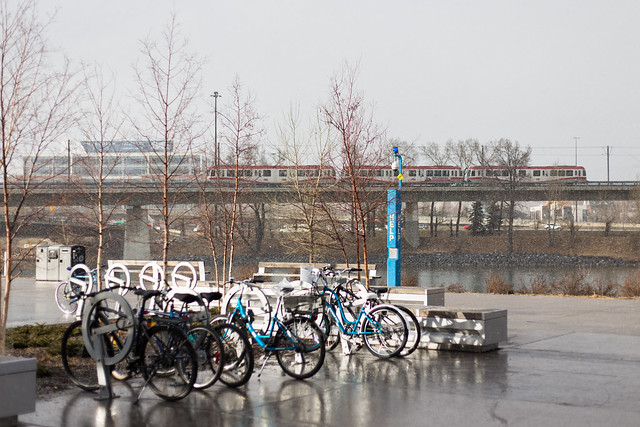
We made the ten minute walk to the East Village from our downtown hotel. We entered via 7 Avenue SE which meant that Celebration Square, or CSquare, was one of the first things we saw. It is meant to “provide a mid-day sunshine break to folks in nearby offices or residents returning home from downtown” and features a curved wooden bench, a small stage, and a striking design. “The Veil’s architectural baffles animate the movement of passing trains,” the website says.

National Music Centre

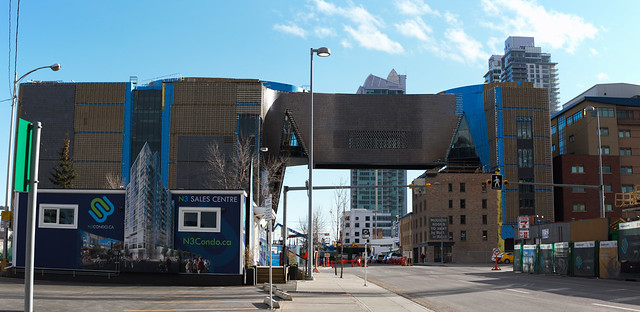
This is the year of music in Calgary as they are hosting the Juno Awards this weekend. Later this year, the brand new National Music Centre will open in the East Village. Just a short walk up from CSquare, you can’t miss the NMC’s unique look. Construction on the project began in 2013:

“Designed by Allied Works Architects of Portland, Oregon, NMC is imagined as a living instrument, a destination and a new kind of cultural institution. The 160,000 square foot, $168 million project is being built around the historic King Edward Hotel – Calgary’s legendary home of the blues – and straddles 4th Avenue SE via an overhead passageway that leads to another vast building.”

A little further away we came across one of the community gardens that has been established in the East Village. Living in the East Village right now would be exciting with all of the changes taking place, but it will be a few more years before the urban village vision is realized.

East Village is Growing

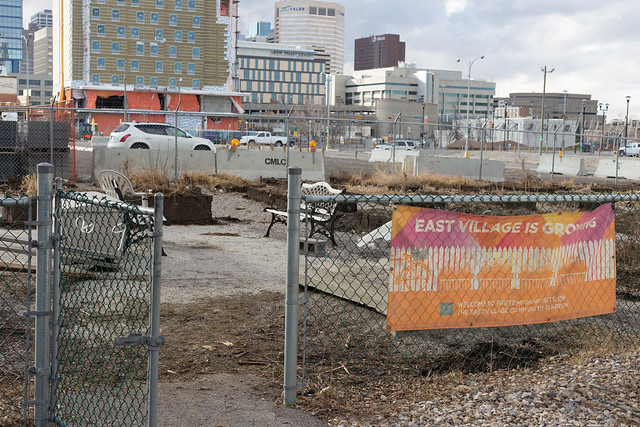
For instance, a grocery store is yet to appear, but one is coming. “The dream team of RioCan Investment Trust and Embassy BOSA are partnering to develop two new residential towers at 6 Avenue and 3 Street SE which will be anchored by a full-sized Loblaws store, as well as other retail tenants.”

Simmons Building

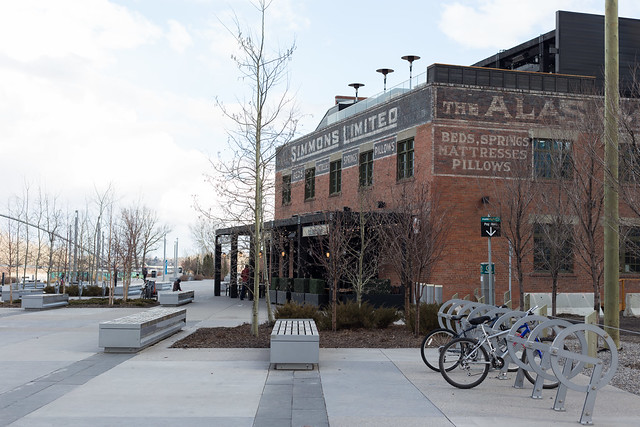
We were perhaps most looking forward to checking out the redeveloped Simmons Building, which just opened last summer and now features Charbar, Phil & Sebastian Coffee Roasters, and Sidewalk Citizen Bakery. Restoration efforts began in 2008 on the historic building:

“Formerly a factory warehouse for a national bedding manufacturer, the Simmons Building snoozed beside the Bow River for decades before CMLC took up the restoration challenge. The occupancy of the Simmons Building by three local food and beverage champions puts in place an important piece of CMLC’s retail strategy for East Village, which calls for approximately 100,000 sq ft of Village Format retail – a ‘boutique’ style of retail that tends to be more intimate and service-oriented than Urban Format retail, which in East Village will add up to about 300,000 sq ft and include such categories as grocery, home improvement and general merchandise.”

On a Friday night, the building was busy, and it just so happened that Edmonton’s own Poppy Barley was hosting a pop-up in the building that weekend! The bike racks were well-used and there were lots of people out enjoying the plaza.

Sunny Snow

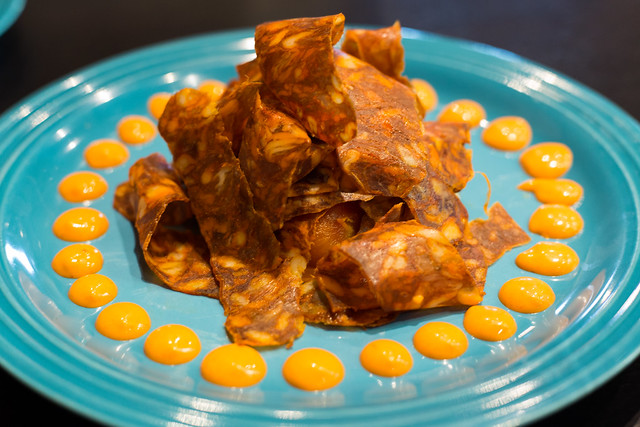
Inside the building, we had a great meal at Charbar! Our favorite dish was probably the picante dry-cured chorizo, served with pickled vegetables, but the entire meal was delicious.

Charbar

The inside of the building reminded me a lot of the Mercer Warehouse, with the exposed brick, beautiful wooden beams, and hardwood floors. With a Phil & Sebastian’s I could definitely see myself hanging out in the building frequently.

Simmons Building

The Simmons Building is located right along the RiverWalk Plaza, part of a beautiful pathway that runs along the river and connects to Calgary’s larger pathway system. Before dinner, we walked along it and made our way to St. Patrick’s Bridge which has been nicknamed the “skipping stone” bridge. It was under construction the last time we had seen it.

East Village

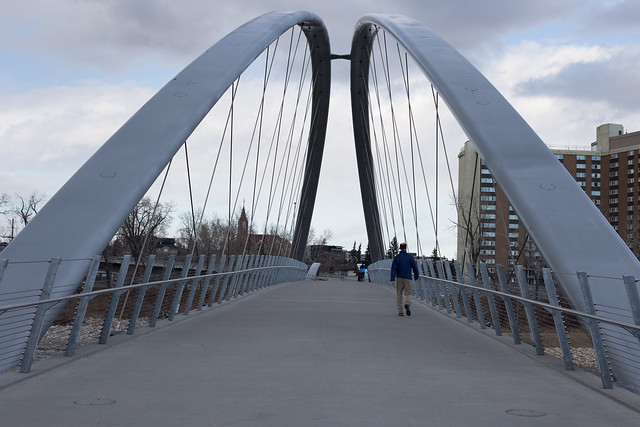
The bridge connects to St. Patrick’s Island which is described as “a beautifully revitalized 31-acre backyard.” Among its many features is Bloom, a public art installation on the west side near the bridge.

Sharon

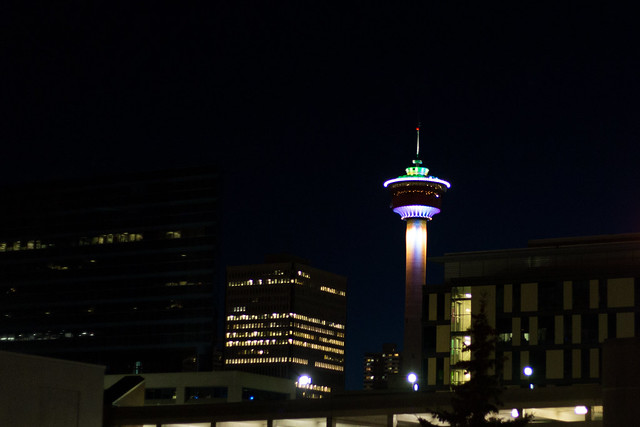
Our short walk back into downtown after dinner offered a great view of the colorfully lit Calgary Tower. It was a great evening in the East Village! We’ll definitely be back to see more of the area’s evolution.

Calgary Tower

You can see more photos from our trip to Calgary here.

Highlights from the 2015 Growth Monitoring Report

The City of Edmonton released its annual Growth Monitoring Report recently, known as Our Growing City. At 90 pages it’s full of information. Here are some things I wanted to highlight!

Upward, Inward, Outward?

growth

The report (and associated infographic) likes to talk about how Edmonton is growing up, in, and out. But is it really?

Several key initiatives demonstrate how this vision guides Edmonton’s growth. The Quarters Downtown, West Rossdale, Blatchford, downtown redevelopment, and Transit Oriented Development are helping our central neighbourhoods and areas along Edmonton’s expanding LRT routes grow “upward.” Ongoing efforts to enable infill opportunities in our mature and established neighbourhoods help the city grow “inward,” and the construction of new neighbourhoods in developing areas enables our city to grow “outward.”

The truth is that developing neighbourhoods, the “outward” part of growth, account for the majority of residential development. The report states that as in 2013, “developing neighbourhoods accounted for 83% of all residential growth” last year. Our city continues to grow out much more quickly than up or in.

You can see the neighbourhood classifications on a map here.

Core neighbourhoods accounted for 8% of all growth in 2014 while mature neighbourhoods accounted for just 6%. “This is an increase of 18% from 2013 unit growth (704 units),” the report says. “It is, however, a relatively low proportion of city-wide growth due to strong increases in newer neighbourhoods.” Established neighourhoods accounted for 3% of all new units.

Nine of the top ten fastest growing neighbourhoods over the last five years are in the south.

The fastest growing are Summerside, The Hamptons, and Windermere.

The only potential bright spot here is that recent NSPs tend to plan more dense communities and “contain a more balanced range of dwelling types” than they have in the past. Here’s a look at the density map:

low density residential lot supply by subsector

You can see that the new areas around the edge may actually be more dense than existing communities in mature and established neighbourhoods. If we don’t do anything to increase the density of those areas, that is.

Demographic Shifts

As of June 30, 2014 the Edmonton CMA had 1,328,290 residents, up 3.3% over the same time in 2013. We’re the second fastest growing CMA in the country after Calgary. And we’re comparatively young.

The Edmonton CMA is comparatively much younger than major Canadian city regions with a median age of 36 years.

Most other cities have a media age of 39-40 years. Our city’s largest cohort is 25-39 years of age, followed by the 49-65 age group.

dwelling unit density by neighbourhood

You might think with all of those young people that we’d have more families. And maybe we do, but not in established parts of the city.

A demographic shift is occurring in mature and established areas of the city. The population is ageing and households are decreasing in size. There will be a significant increase in lone person and two person households.

It’s a complicated issue, but ageing in place means that young families are pushed to the developing areas (as shown in the above map), which means we have to build new schools, recreation facilities, etc. It means we continue to grow outward.

Regional Competition

In 2014, 71% of all housing starts in the Edmonton region occurred within the city, which is better than the 10 year average of 66% (our high was 94% in 1982 and our low was 53% in 1996). But remember, the bulk of our growth is happening in developing areas, and that often means single-detached homes.

neighbourhood summary

Our share of regional single-detached housing starts over the last 10 years has averaged 59%. We don’t have much competition when it comes to folks wanting to live in condos or apartments. But for single family homes, there are lots of options just outside Edmonton’s boundaries. And this is a problem because surrounding communities don’t build communities that are as dense as the ones Edmonton is building.

Zoning & Annexation

boundary history

The report states that the Edmonton region is expected to grow to just under 2.2 million by 2044, with the city itself reaching 1.4 million people by that time. Looking further to 2064 our city’s population is expected to grow to 2.1 million. All those people are going to have to live somewhere, so “approximately 270,000 new housing units” are required to handle the anticipated growth.

This is why the City is pursuing annexation.

“The City of Edmonton is quickly running out of room to accommodate anticipated growth. This is especially true for industrial lands but is also true for residential developments.”

We’re only “quickly” running out of room because our growth pattern hasn’t changed much. There is room to grow inward:

Edmonton’s core, mature and established neighbourhoods share a total of 180 ha of vacant land, with the distribution of this land varying widely amongst them. In total, 1,343 vacant lots have been identified within the central core, mature and established neighbourhoods.

That vacant land could house an additional 3,287 dwelling units and potentially 7,725 people, based on existing zoning. If we re-zoned land and consolidated some lots the potential could be even higher. Not enough for all of the anticipated growth, but more than we’re on track to house centrally.

For the last decade or so, a 2:1 ratio of residential to industrial/commercial land area has continued in Edmonton.

“Without annexation, Edmonton will exhaust its industrial supply of land in 10 years and its residential in 12 to 17 years. The proposed annexation ensures that both industrial and residential land inventories meet the policy target of maintaining a minimum 30-year supply.”

The need for more industrial land is what’s really driving the two currently proposed annexations, in Leduc County and Sturgeon County.

In Edmonton the current proportion of zoned land uses is roughly 32% residential, 3% commercial, 12% industrial, 7% institutional and 9% parks and open space, special “direct control” zones account for 4% of land uses, Transportation Utility Corridor (TUC) 6% and 27% agriculture.

That’s a big drop in agricultural and reserve land, which was at 37% previously. “For the past decade Edmonton has been converting an average of 1,000 hectares of agriculture and reserve zoned land into urban zones.”

More Information

You can learn much more about Edmonton’s growth at the City’s website.

There are also some useful data sets in the open data catalogue. Here are a few that are relevant (but there are dozens):

What else did you find interesting in the report?

Why hasn’t there been any public involvement for the Growth Coordination Strategy?

One of the most important sections in The Way We Grow, Edmonton’s Municipal Development Plan, is the one that deals with the Growth Coordination Strategy. It is section 3.1 that earned the document the nickname “The Way We Sprawl” for specifying that just 25% of housing growth should happen in mature neighbourhoods. That shortcoming aside, the section is important because it aims to make land development in Edmonton more sustainable, predictable, and strategic. Section 3.1.1.6 explains the purpose of the Growth Coordination Strategy:

Develop a growth coordination strategy to address timing and phasing of new residential growth in developing and planned neighbourhoods. The strategy will relate to the City’s strategic goals, current and future public infrastructure investment, long term financial sustainability and the amount, location and pace of population and employment growth; and will establish:

  • Expectations for completing developing neighbourhoods
  • Expectations for initiating new Neighbourhood Structure Plans

Another important point is found in section 3.1.1.10:

The Growth Coordination Strategy will address demand for land, housing units, and housing choice at the regional, city-wide and sector level.

You might find the topic kind of dry but make no mistake, ensuring Edmonton can “manage future public obligations and growth opportunities” is of great importance to our city.

Edmonton from Above
Photo by Dave Cournoyer

Despite the importance of the Growth Coordination Strategy, there are just two full-time employees at the City working on it and thus far there has been no official opportunity for public involvement. The first public draft (version 6) of the strategy (PDF) was released in May, but I understand based on conversations with City employees that that is not the same document slated to go to Council in November. A new draft is currently under development that reduces the scope of the strategy, primarily by stripping it of any objective related to infill development. A similar document focused on mature and developing areas would be left to an as yet unplanned and unfunded follow-up project. That means that Council will be considering a document that no citizen has had the opportunity to provide input on, not to mention one that does not seem to meet the requirements specified in the MDP.

No one I talked to knows (or refused to say) why the timeline for this strategy was set so aggressively. There is no doubt in my mind that powerful, well-funded behind-the-scenes lobbying has taken place. After all, without the Growth Coordination Strategy, Food & Ag Strategy, and Integrated Infrastructure Management Plan, new development in Edmonton’s urban growth areas cannot take place. Furthermore, we know from the January 26, 2011 Executive Committee meeting (see this report) that the “discussions began between Administration and Industry on the content of the Growth Coordination Strategy” as early as July 2010.  I think that pressure from “Industry” partially explains why there hasn’t been any public involvement, but it doesn’t explain why the City has put so little funding into the development of this important document.

The Calgary Approach

Calgary has a number of similar documents and initiatives underway. One is called Geodemographics but the big one appears to be the Corporate Framework for Growth and Change:

The Corporate Framework for Growth and Change will guide the future sequencing of growth in Calgary to ensure investments in infrastructure and services are within the financial capacity of The City. The Corporate Framework for Growth and Change is an integral part of Calgary’s Municipal Development Plan (MDP) and growth management.

Note both the timeline and frequency of public involvement for the development of that document. It began in February 2011 and the first public involvement opportunities – a series of stakeholder meetings, plus a blog post open to public input – took place in September and October of that year. A series of stakeholder meetings and forums have been hosted throughout 2012. To be fair, Calgary took a different approach, with Council approving a set of principles early on and the rest of the project unfolding in four phases, but the fact remains that a significant amount of public involvement has taken and continues to take place.

Another thing to note about Calgary’s project – there are at least ten individuals working on it:

A team from across City Departments called the Corporate Growth Management Project (CGMP) team, has been assembled to create the Framework for Growth and Change.

Edmonton and Calgary both pay lip service to managing growth, but only Calgary seems willing to back that up with the necessary funding.

Designing New Neighbourhoods

In contrast to the Growth Coordination Strategy, the Designing New Neighbourhoods project has unfolded much more predictably with multiple opportunities for public input. The outcome of that project is a set of guidelines for Edmonton’s new neighbourhoods. Section 4.1 of the MDP directed the creation of these guidelines, but unlike the Growth Coordination Strategy, technically nothing depends on their existence.

The draft guidelines are slated to go to Council “in early 2013” and already a number of public involvement opportunities have taken place. In May, there was a series of blog posts and an IdeaScale site was created to harvest ideas from citizens. The project team also encouraged the use of Twitter to suggest ideas, a positive step for public involvement at the City!

Importantly, the project also has a Design Team that is “made up of a diverse group of about 30 people from the local development, urban design, and home building industries, as well as members of the City’s Administration, the Edmonton Federation of Community Leagues, Edmonton’s Schools Boards, and the University of Alberta’s City-Region Studies Centre.” That same post talks about the inclusion of external consultants too.

The City of Edmonton’s page on Public Involvement states:

The City of Edmonton is committed to involving the people affected by the decisions it makes. We seek diverse opinions, experiences and information so that a wide spectrum of information is available to decision makers.

Designing New Neighbourhoods seems to meet that commitment, but unfortunately, the Growth Coordination Strategy does not.

The Ongoing Abatement of Section 3.1 of the MDP

I’m very concerned that the potential impact of Section 3.1 of the MDP has been continually eroded over the last two years. In February 2011, City Council passed a motion (item 6.16) that redefined eight Neighbourhood Structure Plans from “new” to “existing” which means they are no longer subject to the completion of the Growth Coordination Strategy and other documents. Futhermore, it authorized the preparation of six other Neighbourhood Structure Plans.

Only Councillors Henderson, Iveson, and Sloan opposed the motion. In his remarks on the motion, Councillor Henderson said “I really do think this is an undermining of what we passed in the MDP” and that “our tools to deal with how we grow and when we grow in this city – we’re giving them away.”

Why did this happen? It’s not as though Edmonton is running out of places for people to live. Prior to the motion in February 2011, there were 41 Neighbourhood Structure Plans approved (between 1984 and 2010) and at various stages of development. Together, those plans have a planned capacity of 116,000 resident units yet just 19,000 units have been developed. That means 84% of the development in those areas is still outstanding. There should not be such a rush to develop new land.

Again, I think politics are at play. Our current City Council has been good to the development industry, but with a new Mayor and Council slated to take office next fall, there’s no guarantee that will continue. Better to get as much approved now as possible, if you’re in the land development industry. Unfortunately for citizens this means our city continues to sprawl, more or less free of any restrictions. Sooner or later the cost of that sprawl is going to catch up with us.

Should MSI funding be used for Edmonton’s downtown arena?

Even if you’re optimistic and think the Katz Group and the City can resolve their current differences, let’s not forget that the arena project is short at least $100 million. Under the current agreement, that amount is slated to come from “other orders of government” such as the province. Over the last year or so, various ministers have stated that the province will not be providing any new funding for the arena. In May, Municipal Affairs Minister Doug Griffiths said:

“The province is not going to write a separate cheque for a particular project. We provide MSI funding for every municipality in the province, which is $896 million this year. We have proposed that’s going to increase. The reason why we do so is municipalities can choose what their priorities are.”

While the downtown arena project would certainly be eligible under the Municipal Sustainability Initiative (MSI), I have long wondered if it would really make sense to use our limited funding for that purpose. How much MSI funding do we have? What have we already spent? Can we really count on an increase? These are some of the question I’ll explore below.

What is the Municipal Sustainability Initiative (MSI)?

MSI is a way for the province to provide cities, towns, and other municipalities in the province with funding for infrastructure projects. From the MSI website:

In 2007, the $11.3 billion MSI program was announced to provide predictable, sustainable funding for our province’s municipal infrastructure projects to keep our municipalities strong.

The objectives of the program are:

  • To work in partnership with municipalities to manage growth pressures;
  • To provide municipalities with sustainable funding; and
  • To support infrastructure needs.

All eligible municipalities in the province receive an amount each year that is calculated based on the following formula:

  • 48% is allocated on a per capita basis;
  • 48% is allocated based on education property tax requisitions;
  • 4% is allocated based on kilometers of local roads.

A wide range of municipal projects are eligible for MSI funding, which means that each municipality can decide where the money is best spent.

How much MSI funding will the City of Edmonton receive?

Edmonton is slated to receive a total of $2.1 billion by the end of 2021. From 2007 through 2011, we received about $567 million. In order to take advantage of favorable economic conditions, Council also decided to fast-track another $250 million or so, which means we have used roughly $850 million in MSI funding already. This chart shows the amount of funding per year (with FT designating the fast-tracked amount):

That means we have roughly $1.3 billion still to come over the next ten years. The projected amounts for 2012-2021 take into consideration repayments on the fast-tracked amount. The City’s fast-tracking strategy requires an annual repayment of $57 million, including interest for five years, reducing the amount of MSI available in 2012-2016 by $285 million.

What have we spent our funding on so far?

The MSI website provides a list of accepted projects by year for each municipality in PDF. I extracted the data for Edmonton, and organized it in a spreadsheet. Based on the description, I categorized each project as either “new” or “existing” to indicate whether it was for a new asset or to rehabilitate/upgrade/repair an existing one. I also assigned each project a category such as “Parks” or “Transit”. Here’s what we have spent per year:

The total spent is roughly $850 million. The big jump in 2009 was the fast-tracked funding, which allowed us to take advantage of lower construction costs.

Here’s the breakdown of new vs. existing:

As you can see, roughly 53% of our MSI funding has been spent on “new” projects.

Here’s the breakdown by category:

The bulk of our MSI funding has been spent on transit and roads. Parks and recreation facilities are the only other two categories that have received more than $100 million in funding.

A total of 82 capital projects were listed, with an average project cost of $9.9 million. No project has cost more than $100 million. The largest project we have constructed so far was the new Centennial Garage in southwest Edmonton, which had a total project cost of $99 million ($89.3 million of which came from MSI). It would be fair to call that project an anomaly however – only one other project, to rehabilitate several roads for $61 million, came with a price tag greater than $40 million.

Can we count on an MSI increase in the future?

MSI funding has always been tied to the economy. The amount allocated to municipalities over the first five years of the program was reduced due to weaker than anticipated revenues. The City of Edmonton had expected to receive $802 million over the 2007-2011 period, about $235 million more than the $567 million it ended up receiving. That does not bode well for an increase in the future.

Both Calgary and Edmonton have been pushing for an improved funding framework with the commitment to develop a big city charter. The outcome of that initiative, slated to be considered by the Legislature in the spring, could impact the way Edmonton receives funding from the province.

Should we use MSI funding for the arena?

According to the City, the average age of Edmonton’s infrastructure assets is 30 years. At the end of 2011, more than 150 neighbourhoods required renewal. An average annual reinvestment of $400 million over the next three years, plus an average annual reinvestment of $450 million over the 2015-2021 period, is the minimum amount of funding required to renew Edmonton’s existing infrastructure to achieve a reasonable state of repair. This is a big challenge, and MSI funding provides only a piece of the pie.

As shown above, our MSI spend has been more or less equally split between new projects and upgrades or rehabilitation of existing assets. A total of $87.5 million was spent on seven new recreation facilities (either brand new, or additions to existing) from 2007 through 2011. Would we have rather spent all of that on the arena? A number of new projects would need to be postponed if funding was allocated instead to the arena. A total of $384.8 million was approved by Council for recreation and cultural projects in the 2012-2014 Capital Budget.

In a poll earlier this year, two-thirds of Edmontonians opposed provincial funding going toward the new arena. An equal number supported fast-tracking the southeast LRT line to Mill Woods. It would seem that the use of MSI funding thus far more or less aligns with the desires of Edmontonians, with the largest share going toward transit projects (though not all of that was LRT-related).

This decision would ultimately need to be made by City Council, and as we approach an election next year, I’m not sure many councillors would be willing to take money away from important neighbourhood renewal projects or new facilities like libraries and parks for the arena.

Central State of Mind: Judd & Linda

This is the second entry in the Central State of Mind series. To read the first entry, click here. Sharon and I visited Judd and Linda in early October to learn about why they chose to live centrally.

Judd and Linda live in Oliver, though like most people who call the eastern part of the neighbourhood home, they would say they live in Grandin. A short walk from the Grandin LRT station, their 1000 square foot condo is certainly cozy but its location more than makes up for its relative lack of space. The couple moved to the neighbourhood four years ago because they were ready to start a family and their previous home downtown was adult-only. Their daughter Zoe was born two years ago.

Linda, Zoe, Judd

Avoiding or at least reducing their commute played a big role in Judd and Linda’s decision to move to Grandin. Judd works downtown as a mechanical engineer, while Linda works part time in social services in Central McDougall. They’re a one-car household, and they use their vehicle as infrequently as possible. Judd usually walks to work, though he has experimented with a variety of transportation options. Biking to work consistently takes about ten minutes, while taking the train can be quicker or slower depending on whether he misses the train or not. Judd has even ridden his longboard to work, though he says “it’s a lot more work because I have to dodge people on the sidewalks, and I usually end up walking anyway.” Linda used to walk to work, a trip that would take about 30 minutes. “We have friends that get up at 5 in the morning just to get ready for their commutes,” Linda said, as she reiterated the importance they place on living close to work.

Grandin

Location is about more than just commute times, however. “I love being able to just go out for a walk,” Linda said. Judd agreed, adding that proximity to amenities is another reason why they liked the area. “Everything is within walking distance,” he said. Ezio Faraone Park is a short walk away, as are the Legislature grounds, both among the best urban green space that Edmonton has to offer. Grandin is also perfectly situated between Downtown and Garneau, which means favorites like Blue Plate Diner and Transcend Coffee are just a short walk or train ride away. “I love going to the City Market on Saturdays too,” Linda told us. “I try to go a little earlier, it’s a nice walk to get there.” Location wasn’t the only thing that attracted them to the Grandin area, of course. “It’s quiet, tree-lined, and pub free!” Judd quipped when I asked him for additional reasons.

Their current living situation does have its challenges, however. “It would be nice to have a little bit more space,” Judd admitted. Entertaining is difficult with Zoe’s play area concentrated in the living room (she had a very cool toy kitchen that made Sharon jealous). The family is casually looking for something central with a bit more space, but it has to be the right fit. “To get something bigger, it has to meet all the requirements that are met now,” Judd said. “If something bugged us so much, we’d have a realtor!” One of the biggest issues with the smaller space is the layout. Sound seems to travel right to Zoe’s room, often waking her up. She is getting better at sleeping through it, however. Communities they are looking at include Westmount, McKernan, and Bonnie Doon. They’re intrigued by the City Centre Redevelopment, but that’s a bit too far into the future.

Grandin

Another challenge is the lack of shops and restaurants in the area that cater to families with young children. Linda wishes there were more kid-friendly cafes, and mentioned Café O’Play in Riverbend as an example. “In the summer it doesn’t matter so much, but when it gets cold, there aren’t as many places to take Zoe.” Similarly, many of the new restaurants that have opened nearby are focused on attracting adults, not families. Interestingly, grocery shopping has also been a challenge. “Downtown shopping is not baby-friendly,” Judd declared. Grocery stores in the area either don’t carry the items they need, or when they do, often charge far more than at other locations. On one trip to Sobeys for instance, Judd found just one brand of diapers and one brand of baby wipes. “When she grows out of diapers, it won’t be such a big deal,” he said. They usually shop at Save-On-Foods for smaller items, and now are able to make the short trip to Superstore on Kingsway Avenue for baby stuff. They also walk to Planet Organic occasionally.

Much of our conversation revolved around the challenges of having a young child in the core. “We kind of got into a pocket of timing with Zoe,” Judd said, realizing that the things they need and want now will change. “The less she is an infant, the easier everything gets.” Something that is very top-of-mind for Judd and Linda at the moment is wheelchair access. “Having a kid downtown has given me an appreciation for people who are in wheelchairs,” Judd said, noting that strollers and wheelchairs have similar needs and challenges. “If one elevator breaks down, then you’re often having to go quite far to detour,” Linda explained. “That’s why malls are so friendly to parents,” Judd concluded, because they offer multiple seating areas, big washrooms with change-tables, and excellent access.

Grandin

Judd and Linda often compare their situation with friends who live in the suburbs. “It’s the commute, that’s the difference,” Judd said. “We don’t have the 20 minutes stuck in traffic, but we have a smaller space.” He does recognize there’s a tradeoff, in that having a car means you don’t have to think as much about where you’re going. “A car gives you options.” Less stress is just one the benefits of avoiding the commute, however. “Living centrally gives you more time to do other things,” Linda said.

The couple would like to see more families living centrally. “It should be more affordable for younger families,” Linda said. She likes Oliver, but says there needs to be more options for family-friendly housing in central neighbourhoods. That means three bedroom condos, as an example. “Having two kids tips the balance,” Judd said. They are confident they have made the right choice, though even they question the centrally-located/smaller-space tradeoff from time to time. “We are in the minority here. Everyone else in the world does it,” Judd said. “Why does it feel so hard sometimes?”

About Oliver

One of Edmonton’s oldest neighbourhoods, Oliver is also the city’s most populated. According to the 2009 municipal census, more than 18,000 people live in Oliver. Roughly 27% of the population is under the age of 20 and nearly 65% of the population is under the age of 40. There are more than twice as many renters in the neighbourhoods as owners. Accordingly, there are significantly more apartments than single-detached homes. Development began in the 1880s, according to the City of Edmonton, though it wasn’t named Oliver until the 1950s.

Oliver scores an impressive 83 on Walk Score, which is “very walkable.” It also gets a Transit Score of 63 thanks to the Grandin LRT station and 45 nearby bus routes. You can learn more about Oliver at Wikipedia and at the Oliver Community League website. The community league is one of the city’s most active on Facebook and Twitter.

Central State of Mind

Would you like to be featured in the series, or do you know someone else who might like to be? If so, please get in touch!

Central State of Mind: Dan & Kathryn Friesen

Introduction

“Yeah, but you don’t have kids.” Without question, that’s the most common remark Sharon and I hear when we talk about living in the core. Obviously there are families living in central neighbourhoods (32% of the downtown population is under 20 years of age, for instance) but you don’t hear about them as often as you hear about families in new suburban neighbourhoods. That’s one of the reasons that we’ve embarked on a new series we’re calling Central State of Mind. Our goal is to feature Edmontonians who have chosen to live centrally, and we’re kicking it off with a young family that selected King Edward Park over the new neighbourhoods in the south. Certainly we have been inspired by Elise Stolte’s excellent summer series, Living on the Edge, but we think the stories of Edmontonians who have voted with their feet and their money to help Edmonton become a more compact, financially sustainable city deserve to be told as well.

Meet Dan, Kathryn, and Sam

Dan & Kathryn Friesen live in King Edward Park, though when people ask they usually say Bonnie Doon because most don’t know where King Edward Park is located. They’ve lived in their current home for four years now, after moving from a condo in the heart of Old Strathcona near 80 Avenue and 105 Street. Choosing a mature neighbourhood was an important decision that Kathryn & Dan put a lot of thought into. Newer neighbourhoods in the city seem to get most of the attention, but not everyone chooses to live there. Sharon and I sat down with Kathryn & Dan at their home in early August to learn more so that we could share their story.

Kathryn & Dan

One of the biggest factors that went into their decision was commuting and their desire to avoid it as much as possible. “It seems like a waste of resources and a waste of time,” Dan said. The location they chose is split between Kathryn’s office downtown and Dan’s office in the south side (they both work in social services). Each can get home from work in less than 20 minutes, even in heavy traffic. “The time commuting takes away from time you can spend with your kids,” Kathryn told us as we watched her two-year-old son Sam play in the backyard. Before Sam was born, Kathryn would either bike or bus to work, but now she drives so that she can take him to daycare. Dan usually bikes to work. They’re a one-car-household, though they do have access to their parents’ vehicle if necessary.

Another factor was walkability. “I love that we can walk to so many places,” Kathryn said. “It was important to incorporate that kind of physical activity.” The Safeway at Bonnie Doon is within walking distance, as is a Korean restaurant that the couple enjoys (they lived in Korea for a time). There are also plenty of playgrounds within walking distance. “There’s a great playground with a spray park less than a five minute walk away,” Kathryn told us. King Edward Park, Duncan Innes Park, and Avonmore Park are all within walking distance, and Idylwylde Park is only a little further away. Additionally they have good access to bike trails and can get into Mill Creek Ravine easily. The day before we visited, they had biked to Heritage Days at Hawrelak Park.

Backyard

As a new mom, access to programs, services, and other families was important to Kathryn. She was part of the New Moms Network at the Bonnie Doon Public Health Centre, just a ten minute walk from home. The moms group she is a part of now has 30 people – Kathryn & Dan told us there are a lot of families in the area. “There’s a lot of play in the front yards, it’s not all hidden in the back,” Kathryn said. She said that families in the neighbourhood often join each other for walks. In addition to spending time in the neighbourhood, Kathryn also frequents Kinsmen, within biking distance (or a short drive), and the downtown library, which she takes the bus to get to. “I talk to other new moms living on the outskirts, and they talk about the need to drive to get to those programs.” She has a lot of praise for EPL and its drop-in programs, such as Sing, Sign, Laugh & Learn. “I have no idea what I haven’t given up because I just look at all these things I have access to that are free!” She said that similar programs in the south side (in the newer neighbourhoods) are usually for-profit.

Dan was comfortable choosing an older home, even though there’s a lot of upkeep. “I could make a list of things this house needs that is pages long,” Dan mused, though he pointed out that newer homes aren’t problem-free either. “With newer homes you often have to fight the developers or builders.” Their house had been updated in recent years, with new windows, a new roof, a new hot water heater, etc. “All of the essentials were done,” Dan told us. He thinks there is certainly some truth to the notion they don’t build houses the way they used to. “The structural elements of the house are solid,” he said. “But you still have to look for a house that has been kept up and looked after.”

King Edward Park Home

Of course, Kathryn & Dan were thinking about the future when they chose King Edward Park as well. The neighbourhood has two great schools – Donnan and St. James. Additionally, Avonmore School is only a few blocks to the south. “Schools in mature neighbourhoods seem to have more unique programs,” Kathryn told us. The family is also excited about a new LRT stop as part of the Southeast LRT to Mill Woods line. In addition to Bonnie Doon, a stop has been proposed for 73 Avenue and 83 Street.

Living in a mature neighbourhood that doesn’t require as much driving has had a positive impact on the way the family goes about its day-to-day activities. Kathryn calls it “slowing down” and finds she has to choose to do one or two things, instead of many. “When you live in the suburbs and you’re driving places anyway, you end up packing more into your day.” It might take more time to choose the bus, but Sam loves the ride and Kathryn doesn’t feel like she’s dragging him from place to place. “Less lugging, more hugging,” she said. “I find we’re just so much more relaxed.”

King Edward Park

Dan & Kathryn are certainly happy with their decision to live in a mature neighbourhood, and they suggested the choice is more common than people think. “We’re not an anomaly,” Kathryn declared. “People think we’re an anomaly, but we’re not.”

About King Edward Park

According to the 2009 municipal census, nearly 4400 people live in King Edward Park. Roughly 32% of the population is under the age of 20 and 64% of the population is under the age of 40. The neighbourhood is split evenly between owners and renters. Single-detached homes are the most common type of structure, followed by low-rise (under 5 stories) apartment buildings and duplex/triplex/fourplex buildings. According to the City of Edmonton, the neighbourhood was annexed in 1912 but most development didn’t occur until the 1950s.

King Edward Park scores 72 on Walk Score, which is “very walkable”. The neighbourhood is included in the Mill Creek South Community Walking Map. It gets a Transit Score of 60 which is “good”, thanks to 41 nearby bus routes. King Edward Park is one of six neighbourhoods in Edmonton to take part in the speed reduction pilot, with speed limits lowered to 40km/h.

The neighbourhood is scheduled for reconstruction as part of the 2012-14 construction program (work will include roadway construction, street lighting upgrades, and sidewalk, curb, and gutter reconstruction). It was part of the drainage renewal program last year.

Central State of Mind

Would you like to be featured in the series, or do you know someone else who might like to be? If so, please get in touch! And if you haven’t already read it, David Thompson’s column on the cost of urban sprawl in Edmonton is definitely worth your time.

Celebrate Your Neighbourhood Spirit: Edmonton Community Challenge

Last July I attended an event called the Community Challenge, co-hosted by Edmonton Next Gen and the Edmonton Federation of Community Leagues. Its purpose was to bring next-geners together to discuss how to improve and work with community leagues. That event was the first collaboration between the two organizations, and it was pretty successful!

Now NextGen and EFCL have teamed up again, this time for the Edmonton Community Challenge:

The Edmonton Community Challenge is a volunteer-driven event that aims to promote community spirit through friendly competition. By registering to join teams that represent community leagues throughout the city, individuals can support local charities, get to know others in their community, and win some great prizes! The event challenges will take place throughout the month of June, and teams will be rewarded based on a pre-determined point system for their energy, creativity, and commitment to sustainability.

I think it’s a neat idea. The big prize is a $15,000 fund for the winning community league which will be spent on a capital project in the neighbourhood. There are also smaller individual prizes to be won along the way.

Here’s how it works:

  1. Register, by June 1.
  2. Get a passport from your team captain.
  3. Bring your passport when you participate in the events and get it stamped! The key events are the Pancake Breakfast (on ShareEdmonton), the Neighbourhood Cleanup (on ShareEdmonton), the 24 Hour Bike Repair-a-Thon (on ShareEdmonton), and the “Can It” Challenge (on ShareEdmonton).
  4. Check the rankings. The team with the most points at the end of June wins.

If you need a little nudge to register, how about this: one of the prizes will be an Apple iPad! Remember, you have less than a week to register!

Stay tuned to the ECC website for news & updates, as well as Edmonton Next Gen on Twitter.

Thoughts on Connections 2010

On three Thursday evenings in April the City of Edmonton hosted an event called Connections 2010, designed to connect residents with City staff to learn about programs, services, and projects. Organized by the Office of Great Neighbourhoods, Connections 2010 brought more than 40 City departments and programs together under one roof.

The first was held on the southside on April 15 at Taylor University College. The second was held on April 22 for westside residents at the Mayfield Inn & Suites. The third and final event was held on April 29 at the Alberta Aviation Museum, and that’s the one I finally made it out to.

Connections 2010Connections 2010

Upon arriving I was greeted and given a quick rundown of what to expect: booths spread throughout the venue, and a stage in the back corner that would have different presentations every half hour. I missed the first on Capital City Clean-up, but arrived just in time to hear Councillor Batty speak about EXPO 2017. There were about a dozen people who listened to the brief pitch.

Next I walked around the museum, stopping at a number of the booths to chat with the City staff who were present. There were some really great displays – my favorites were the one explaining where your tax dollars go, and the Safe Communities one that featured a speed gun and display to see how fast you were walking. I also had a great chat with a young lady from the Waste Management branch.

Connections 2010Connections 2010

Eventually I made my way to the garbage can that a number of people were painting. It was destined for the African Centre, part of a program to beautify trash receptacles at community centres around the city. I’m really not an artist, but I was convinced to help paint a small part of it:

Connections 2010

It was kind of fun actually!

In total I probably spent about an hour and a half at the event. I thought it was a decent event, but there’s lots of room for improvement. Here are my thoughts:

  • Attendance was pretty disappointing. Maybe 100 About 210 people attended the evening I was there, and I’m told that was the busiest night of the three.
  • The silver lining to the low attendance was that City staff from various departments had the opportunity to learn about one another.
  • I found out from Treena Schmidt, one of the event organizers, that the booths were laid out according to the Transforming Edmonton themes – the way we move, the way we grow, etc. I thought that was pretty smart! It’s great to see more City events/programs thinking in the context of the bigger picture.
  • I’m not sure the venue choices were particularly good. I would rather have seen one closer to downtown, maybe at the MacEwan campus or in Enterprise Square. Another idea would be to host one of the nights at a high traffic location, like a shopping mall or something.

I also asked Treena if her team had consulted with any other similar events, and she said was very honest and said no. I mentioned Everyone for Edmonton, which I immediately thought of as I walked through Connections. I think the thoughts I wrote about how to improve that event are all relevant for Connections as well, in particular the need for a “hook”. Why not showcase local artistic talent at the event? Local performances can be a great draw. You can get information on all of the City’s programs and services online. I think there needs to be something else to attract people.

There’s probably also something to be said for improved promotion. I think the Great Neighbourhoods team organized this year’s series of events pretty quickly, so hopefully they’ll have more lead time next year. I think there’s a solid base they can build upon, and I look forward to an improved Connections series next year!

You can see the rest of my photos from the event here.

Edmonton Neighbourhood Census Data

For a long time I’ve wanted to get the City of Edmonton’s neighbourhood census data in CSV format (or really any usable format other than PDF). Recently, with the help of Laura (and Sandra) at the City’s Election & Census Services department, who I met at the Open City Workshop, I finally got it. And now you can have it too!

Download the Edmonton Neighbourhood Census Data in CSV

I’ve also emailed this to the City’s open data team, so hopefully they can get it in the data catalogue soon.

Visualizing the Data

Why is having the census data in a format like CSV useful? Well for one thing, it enables creatives to do stuff with that data through code or other tools. For instance, I was able to generate a heat map for the City of Edmonton:

The darker sections are more heavily populated, the lighter yellow regions are less populated.

Not all neighbourhoods are reflected, as the City does not release details for neighbourhoods with a population between 1 and 49. Here are some other things we can learn from the data set:

  • Total population in the data set is 777,811, which means there are 4628 individuals unaccounted for (total for 2009 was 782,439).
  • The average neighbourhood population is 2424, or 3039 if you exclude neighbourhoods with a reported population of 0.
  • The median neighbourhood population is 2216.
  • Oliver and Downtown are the only two neighbourhoods with a population greater than 10,000.
  • More dwellings are owned (192,171) than rented (121,953).

ShareEdmonton

Another reason having this data in CSV is useful is because app developers can more easily integrate it into the things they are building. For example, all the census data is now available at ShareEdmonton! So when you view a neighbourhood, you’ll see the census data on the right side (see Alberta Avenue for example). You can also browse neighbourhoods by population. I’ve also fixed the neighbourhood search, so it works better now.

This is just the first of a few neighbourhood-related updates this month, so stay tuned for more!

Apps4Edmonton

Yesterday the City released more information on the Apps4Edmonton competition. The first phase, from now until May, is “accepting community ideas”. Basically they want you to tell them what data you want. Aside from the obvious “we don’t know what we don’t know” problem, I think the community has done a pretty good job of defining desired data sets already.

They City had a great start in January with the launch of the data catalogue, but we need more data. Especially data like the census data, which myself and many others have been asking for since the day the PDFs were released. There are clearly some internal issues that need to be worked out if I was able to acquire this before the open data team was. I hope they get everything resolved for the competition, because it’ll be a pretty boring one if we still only have twelve data sets (New York and other cities had dozens, maybe even hundreds, before their competitions).

That said, I know there are passionate, smart people working on it. Email opendata@edmonton.ca if you have data set requests or want to get involved in Apps4Edmonton.