Edmonton’s population rises to 899,447

The results of Edmonton’s first ever paperless municipal census were released at City Hall today, revealing that Edmonton’s population has grown by 2.5% since 2014 from 877,926 to 899,447. That is much more modest growth than we saw in the period between 2012 and 2014 when our city’s population grew by 7.4%. From today’s news release:

“The impact of the recent economic slowdown and higher unemployment in Alberta and Edmonton is evident in the stable population growth figures recorded over the past two years,” said John Rose, Chief Economist for the City of Edmonton.

The slowdown mirrors to some extent what is happening provincially and federally. Estimates put Alberta’s growth rate at 3.9% from 2014 to 2016, down from 6.5% between 2012 to 2014, and Canada’s growth rate at 2.0% from 2014 to 2016, down from 2.3% between 2012 and 2014.

IMG_1154.jpg

The update to the Capital Region Board’s Growth Plan projects that Edmonton’s population will grow to at least 1.3 million people by 2044, which we’ll achieve if we can grow at an average of 1.8% per year.

“Although we saw more moderate growth these past two years, Edmonton’s population has increased by 117,000 since 2009. When you add to that the growth of neighbouring municipalities, it highlights the need for us to combine our efforts to ensure effective use of land and smart infrastructure planning.” said Mayor Iveson. “We need to work together and leverage our resources as well as those of the provincial and federal governments to ensure an ongoing strong and growing region, one that continues to attract and retain people and investments.”

Regional cooperation is especially important because it looks like Edmonton is getting even more suburban. Ward 6, which includes Downtown, Oliver, and other central neighbourhoods, saw its population decrease 5.0% from 2014 with a loss of 3,769 people. In fact, the centrally-located wards (6, 7, 8, 10, 11) all saw their populations decrease by anywhere from 2.2% to 5.0% while the outer wards (1, 2, 3, 4, 5, 9, 12) all saw their populations increase by anywhere from 1.1% to 12.1%. This is a big shift from the 2014 Municipal Census in which every ward grew.

2016 census by neighbourhood

It’s disappointing to me to see “population loss in a number of core and mature neighbourhoods” while the developing neighbourhoods like Walker, Laurel, Summerside, Chappelle, Windermere, and McConachie all show strong population gains. A decrease of 1,012 people in Oliver and 380 people in Downtown is cause for concern. Inglewood, Central McDougall, and Strathcona were some of the other central neighbourhoods that saw their populations decrease. We are continuing to grow out when we really need to be growing up.

You can see a comparison of census results from 2016, 2014, 2012, and 2009 in PDF here. There are 201 datasets related to Edmonton’s municipal census in the Open Data Catalogue with more to come. You can also access the latest results in PDF here. And here’s my post about the 2014 Municipal Census.

Edmonton’s population rises to 877,926

Mayor Don Iveson announced the results of the 2014 Municipal Census this morning, revealing that Edmonton’s population has grown by 7.39% since 2012 to a total of 877,926. That means we’ve added a population the size of St. Albert over the last two years, which is incredibly significant growth for a city of our size.

Edmonton Municipal Census 2014

Edmonton has grown by nearly 100,000 people over the last five years, and is on track to reach the 1 million mark by the end of the decade.

“Edmonton’s population growth indicates that we are a city of opportunity,” says Mayor Don Iveson. “Significant growth in the working-age population puts Edmonton in a good position for the long term. While our economic stability, educational opportunities and quality of life attract newcomers to Edmonton, we face pressure to manage our growth responsibly and effectively.”

In the last ten years, Edmonton has grown by more than 175,000 people, and the pace of growth seems to be accelerating.

2014 census growth

Edmonton is one of the youngest cities in North America, with an average age of about 35, the same as our Mayor. The single largest age group is 20-25, followed closely by 30-34, which account for a combined 17.2% of Edmonton’s population. “This is a population profile that any city would envy,” said John Rose, the City of Edmonton’s Chief Economist.

2014 census gender and age

We’re an evenly split city in terms of gender, with 49.5% of the population identified as female and 50.5% identified as male. Unfortunately, the census does not offer any options for transgender individuals.

2014 census marital status

We’re also fairly evenly split between single and married and Edmontonians.

Edmonton’s population is growing all across the city, but nine of the top ten fastest growing neighbourhoods over the last five years are in the south. Summerside, The Hamptons, Windermere, Ambleside, and Tamarack are all examples of fast growing neighbourhoods. Sixty mature neighbourhoods and forty-seven established neighbourhoods gained in population. A total of forty-four established neighbourhoods and thirty-nine mature neighbourhoods experienced a population loss over the last five years. Every ward gained in population, with Ward 9 and Ward 12 showing the strongest growth.

2014 census neighbourhoods

The population of Downtown now stands at 13,148, an increase of 7.8%. That signals significantly faster growth than the neighbourhood was experiencing previously, as it grew just 5.4% between 2009 and 2012.

2014 census employment status

Edmonton continues to have low unemployment, with 54.2% of Edmontonians employed, 25.0% in some sort of schooling, and 12.2% retired. Just 3% reported being unemployed.

2014 census transportation

A smaller percentage of Edmontonians are driving to work than in 2012, with carpooling and transit use seeing modest increases. The caveat is that groups aged between 12 and 18 and over 65 were included in the 2014 census and were not included in the 2012 census, so the difference is probably smaller than the numbers would suggest. Edmontonians continue to primarily drive to work.

We continue to live primarily in single detached houses, with 59.8% of Edmontonians reporting that as their dwelling type. As for the primary language spoken in homes across the city? Overwhelmingly, it’s English. The next most common languages are French, Tagalog, Cantonese, and Punjabi.

2014 census language

The City also asked how households access information regarding City services. More than 25% use the City website, with newspapers, radio, and 311 as the next most popular methods.

2014 census resource access

This year, the census was conducted online as well as door-to-door. The City says about a third of respondents used the web-based option. Those individuals had the opportunity to answer one extra question, which was which additional sources or channels they’d like to use to receive information about City services. Overwhelming, email was the most popular response.

I’ll be digging into the results further over the next couple of days, and you can too – the City has made 58 datasets available in the Open Data Catalog. You can read my post about the 2012 Municipal Census here.

The next municipal census will take place in April 2016.

Annexations in Edmonton

The City of Edmonton officially announced today its intention to annex a large area south of our current boundaries (you can listen to the press conference here). The plan would see 120 km2 west of the QEII highway annexed, an area which includes the Edmonton International Airport, and about 36 km2 east of the QEII annexed, which would include most of the area between Edmonton and Beaumont. According to Mayor Mandel, the new space would be used for both residential and industrial development. You can read much more about the news here, and be sure to check out the City’s page on the proposed annexation. It is estimated that the annexation could be completed in as little as two years. You won’t be surprised to hear that I’m less than enthusiastic about the news.

Edmonton’s Annexations

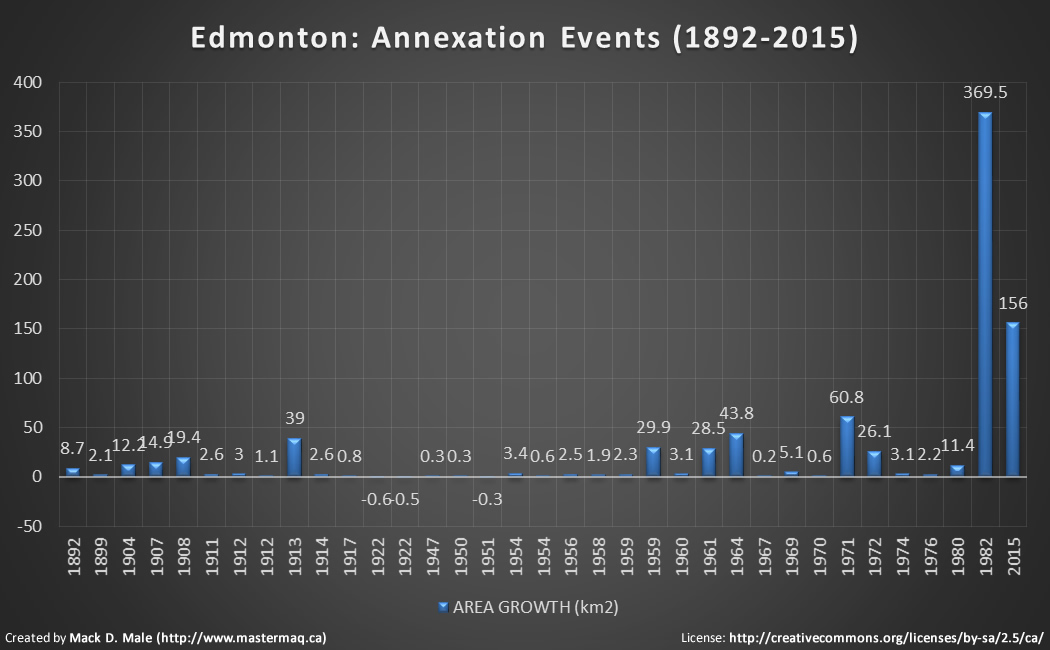
I’ll write more about that specific proposal in the future, but for now I thought it would be useful to take a look at Edmonton’s previous annexations. I have included the proposed annexation in the data below however, to give you a sense of where it fits in (I went with 2015 as the year). There have thus far been 31 annexation events in Edmonton’s history, according to a document prepared by the City’s planning department. That includes the incorporations of both Edmonton and Strathcona, as well as three temporary separations. Most of those annexations were relatively small, with an average annexation area of about 21 km2. Take out the 1982 annexation however, and the average drops to just 10 km2.

Here’s what those annexation events look like on a chart:

As you can see, the annexation in 1982 was unusually large – it doubled the size of our city. The proposed annexation in the south would handily come in as the second largest annexation in Edmonton’s history.

Here’s the list of annexation events:

YEAR DESCRIPTION CUMULATIVE AREA (km2)
1892 Incorporation of Town of Edmonton 8.7
1899 Incorporation of Town of Strathcona 10.8
1904 Incorporation of City of Edmonton 23.0
1907 Incorporation of City of Strathcona 37.9
1908 Buena Vista to Westmount, North Inglewood to Eastwood/Virginia Park 57.3
1911 Highlands, Amalgamation of Edmonton & Strathcona 59.9
1912 Belmont Park 62.9
1912 Kennedale 64.0
1913 Dominion Industrial to Quesnell Heights / Brander Gardens to Parkallen, Bonaventure to Belvedere, Forest Heights to Argyll 103.0
1914 Allendale / Duggan to Coronet / Papaschase 105.6
1917 Calder 106.4
1922 Separation of north Brander Gardens 105.8
1922 Separation of Papaschase 105.3
1947 Pleasantview 105.6
1950 Whitemud Creek 105.9
1951 Separation of part of Duggan 105.6
1954 Capilano / Fulton Place 109.0
1954 Coronet 109.6
1956 Gold Bar 112.1
1958 Davies Industrial 114.0
1959 Terrace Heights / Ottewell 116.3
1959 Terwillegar Park / Riverbend to Strathcona Industrial Park, re-annexation of separations 146.2
1960 Ottewell to Girard Industrial 149.3
1961 Beverly / Clareview to Dickinsfield 177.8
1964 Jasper Place and Southeast Industrial 221.6
1967 Clover Bar Power Plant 221.8
1969 Springfield / Callingwood 226.9
1970 Springfield – north 227.5
1971 Castle Downs / Lake District and Mill Woods 288.3
1972 West Jasper Place 314.4
1974 Kaskitayo 317.5
1976 Northwest Industrial 319.7
1980 Pilot Sound and Twin Brooks 331.1
1982 Northeast, Southeast, Southwest Urban Growth Areas 700.6
2015 Proposed South Annexation 856.6

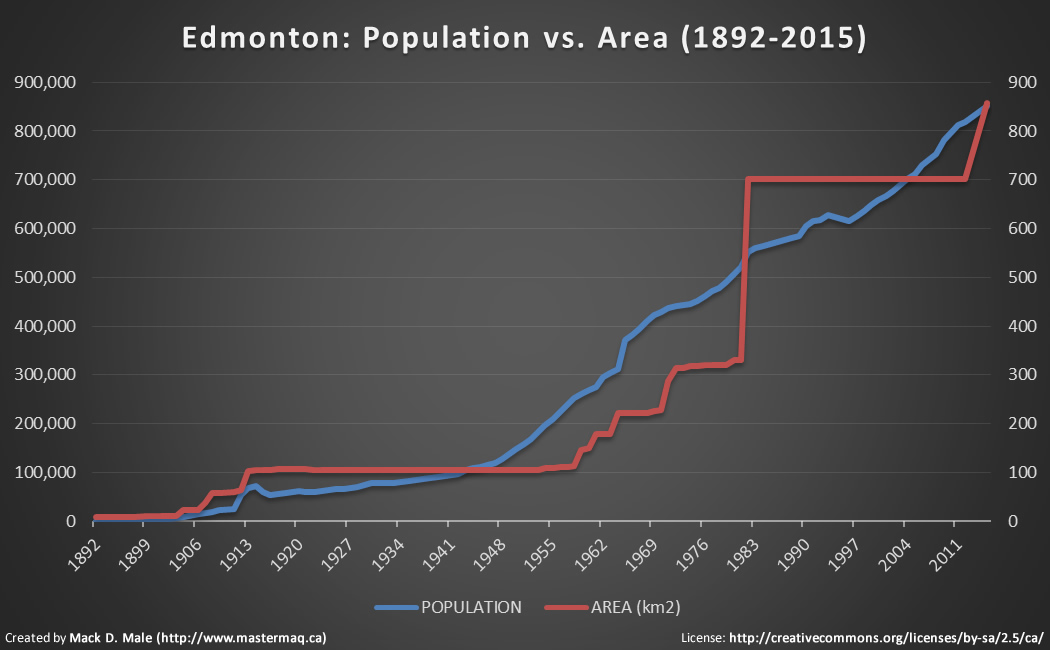
Municipalities annex land for a variety of reasons – sometimes the goal is to acquire industrial land, other times its to start developing future residential neighbourhoods. Here’s what our land and population growth has looked like over the last 120 years:

The left axis and blue line shows the growth in Edmonton’s population, while the right axis and red line shows the growth in Edmonton’s land area. While our population has risen steadily, annexations have been much less consistent.

Impact on Population Density

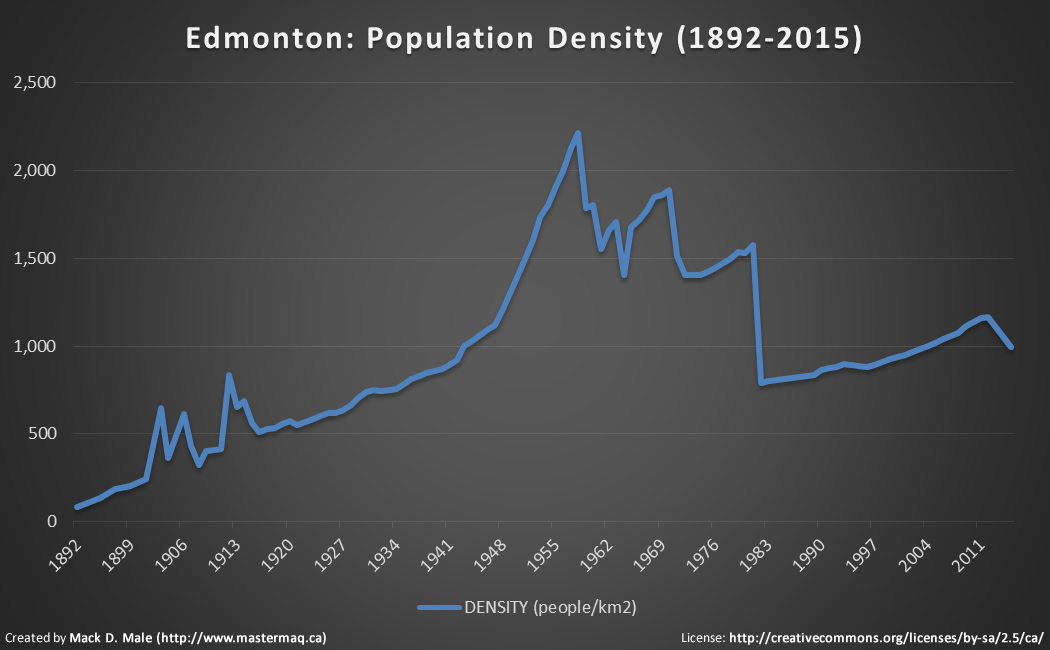
When the Town of Edmonton was incorporated in 1892 it consisted of 8.7 km2 of land and was home to about 700 people, giving us a population density of about 81/km2. Today, with a population of nearly 818,000 and a total area of about 700 km2, we have a much higher population density of roughly 1,167/km2. That’s not the highest it has ever been, however. Edmonton’s population density peaked in 1958 at about 2,212 people/km2 and has been falling ever since.

(For comparison purposes, New York City’s population density is 10,430/km2, London’s is 5,206/km2, Toronto’s is 4,149/km2, Vancouver’s is 5,249/km2, and Calgary’s is 1,329/km2. Yes, even sprawling Calgary has a higher population density than us!)

Here’s what our population density looks like on a chart:

There are a couple of key events to point out. The amalgamation of Edmonton and Strathcona in 1912 is noticeable thanks to a jump in the population. The annexations in 1959 of Terrace Heights, Ottewell, Terwillegar Park, and Riverbend marked the start of our population density decline. The jump back up in 1964/1965 was due to the annexation of Jasper Place, which brought about 38,000 residents to Edmonton in addition to more space. The large drop in 1982 is extremely apparent, and while the population density has slowly been creeping back up, you can see that the proposed annexation would cause it to decline once again.

Looking at the Capital Region

I absolutely agree with Mayor Mandel that a strong Edmonton is a strong region, but I don’t necessarily agree that Edmonton needs to acquire more land in order to remain strong. Supporters of annexation may suggest that Edmonton’s declining proportion of the region’s population is proof that buyers are not finding what they’re looking for within the city so they’re going elsewhere.

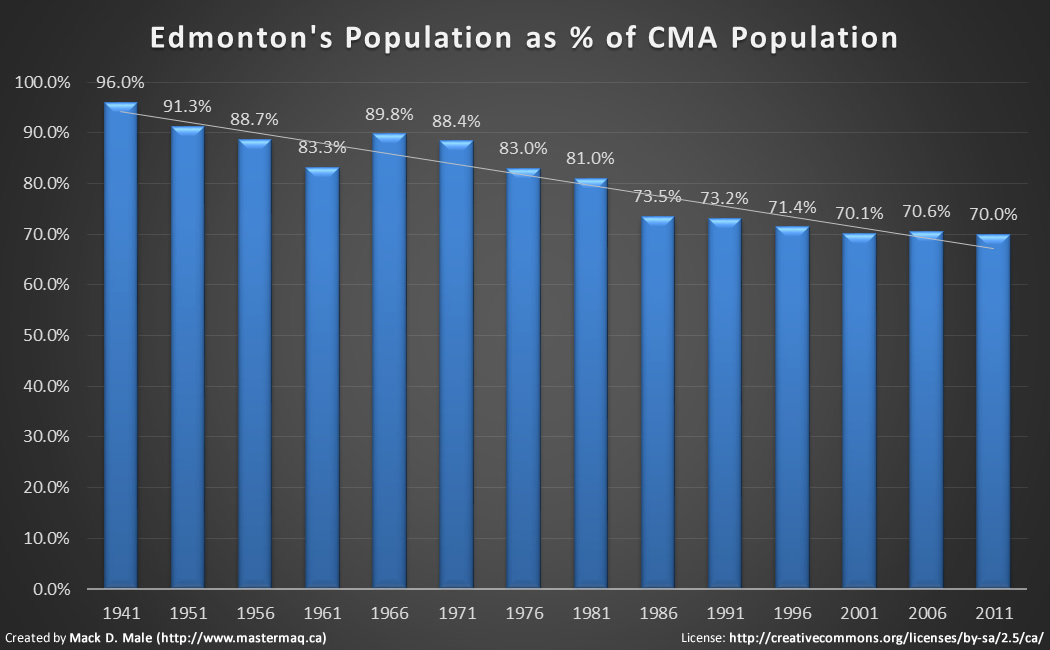
Here’s a look at the percentage of people in the Edmonton CMA who live within the city limits:

What’s clear is that there has been a decline in the proportion of people living in Edmonton-proper versus the surrounding areas. What’s less clear is why that has happened.

While Edmonton has not annexed any land since 1982, there have been 6 annexations by other municipalities in the region in the last 15 years.

Other Resources

Annexation is a big topic. Here are some additional resources that you may find useful:

Edmonton’s new official population is 817,498

This morning the results of the 2012 Municipal Census were released, and Edmonton’s new official population is 817,498. That represents annual average growth of about 12,000 since 2009 when the last census was conducted.

Mayor Mandel seized on the numbers related to age – the largest proportion of residents are in the 25-34 demographic (about 14.5%):

“The growth in population indicates that Edmonton is a city of opportunity,” said Mayor Stephen Mandel. “It is gratifying and exciting to know that so many young people are calling Edmonton their home. This reinforces the appeal of Edmonton, and the value of what our City has to offer; opportunity, culture and quality of life.”

Here’s what our growth curve looks like:

Here’s a look at the population by age group:

One of the new questions asked this year was about mode of transportation from home to work. The results are not incredibly surprising – roughly 80% of Edmontonians get to work by automobile:

You can see all of the results here, including PDFs for each ward and neighbourhood. Unfortunately I can’t do a detailed comparison by neighbourhood, because the open data catalogue has not been updated and I’m not going to sift through 375 PDFs to get the data I need. A note on the website reads: “2012 results will be added to the Open Data Catalogue in early August.” While I suppose it’s a positive that the data will in fact be uploaded to the catalogue, there’s absolutely no excuse for it not already be in there. I feel like I’m fighting the same fight, three years later.

I was most interested in Downtown however, so I did look at the PDF. The population increased far less than I had anticipated, rising to 12,199 from 11,572 (growth of about 5.4%). In other words, just 1.8% of the city-wide population growth occurred in the Downtown neighbourhood. Clearly we still have work to do (perhaps surrounding neighbourhoods grew more, will wait for the open data to analyze that).

Last year City Council passed a new Municipal Census Policy which states that a census will be conducted every two years starting in 2012. Throughout the month of April, census workers knocked on doors asking Edmontonians a variety of demographic questions. The results are important because many grants from other orders of government are calculated on a per capita basis. Additionally, the City needs updated numbers to effectively plan services, and to ensure ward boundaries result in fair representation by population.

The next Municipal Census will be held in April 2014.

Edmonton’s population is up 12.1% according to the 2011 Federal Census

Statistics Canada today released the first set of information for the 2011 Federal Census, focused on population and dwelling counts. The population of Canada has increased 5.9% since the 2006 census, compared with 5.4% for the previous five-year period.

Canada’s population increased at a faster rate than the population of any other member of the G8 group of industrialized nations between 2006 and 2011. This was also the case between 2001 and 2006.

Canada’s population now sits at 33,476,688. Looking at the provinces, Alberta leads the country in growth with an increase of 10.8%, taking our population up to 3,645,257, which is about 11% of the country.

Increasingly we are an urban country. A total of 69.1% of the population lives in one of Canada’s 33 census metropolitan areas (CMAs), and that number is going up:

The rate of growth between 2006 and 2011 was 7.4% in CMAs as a group, above the national average of 5.9%. The two fastest growing CMAs were both in Alberta: Calgary, where the population rose 12.6%, and Edmonton, where it increased 12.1%.

Here’s a look at the fastest growing CMAs in the country:

Looking at federal electoral districts in the Edmonton region, Edmonton-Leduc was the fastest growing with 28% growth since 2006 census, followed by Edmonton-Mill Woods-Beaumont at 22%.

Looking at Edmonton more generally, the population of the city now sits at 812,201 while the population of the CMA is now 1,159,869. Here’s the population for the City and the CMA over the last fifteen years:

And here’s the percentage increase over that same time period:

Edmonton is now the sixth largest CMA in the country, and we’re growing more quickly than anticipated.

We’ll have to wait until May 29 to learn more about the age and gender breakdown, September 19 to learn more about households, marital status, and structure types, and October 24 to learn more about language.

The City of Edmonton is conducting another municipal census in April this year, and is looking for 1400 people to act as census workers. You can apply in person at City Hall. You can learn more about the municipal census here.

You can learn more about the 2011 Federal Census here, and also check out The Daily for today.

What’s the population of Edmonton’s downtown? Depends on the time of day.

Revitalizing our downtown is constantly in the news lately thanks to the proposed arena project. I’m glad that the issue is top-of-mind for so many people at the moment, and I hope we can keep that interest going. I think everyone agrees that Edmonton’s downtown does not currently represent our city as well as it should.

There are lots of factors that go into revitalizing an area. Probably even more that go into revitalizing a downtown. But there’s one factor in particular that for me stands out above all others. Residents.

I think if you really want to revitalize an area, you need to get more people living there. We’ve already seen this play out in Edmonton to a certain extent. Here’s what our downtown population growth has looked like since 1986:

Keep in mind the population has really only slightly more than doubled in that time. Not what you would call really significant growth. And yet look at all of the positive changes we have seen downtown in that time! This article by Lawrence Herzog from 2003 covers some of the changes up to that point quite nicely. People regularly point to 104 Street as a positive example of change downtown. It’s why Sharon and I bought here.

The factor that most often comes up as vital to revitalization however, is the number of people working downtown. Sometimes the argument made is quite compelling too. Whenever I hear that argument, I think of this graph:

It’s incredible how widely the population varies from the weekend to a weekday. And this doesn’t even take into account students and all of the other groups of people that might be downtown on a weekday. Is our downtown population 12,000 or 68,000? It absolutely depends on the time of day!

Why does nearly everything downtown close so early on weekdays? Why is almost nothing open downtown on Sundays? Why isn’t downtown changing as fast as we’d like it to? I think that graph tells a very significant part of the story (see below for an explanation and sources).

The numbers are certainly not encouraging:

  • As of 2009, downtown Edmonton’s population was 11,572. That’s just 1.5% of our total population.
  • As of 2010, downtown Edmonton’s workforce was roughly 67,700. That’s just over 10% of our total labour force.
  • Current plans call for the addition of just 12,200 new residents residential units over the next 35 years, and an increase in residents to 24,000 by 2030. We more than doubled the population in 23 years, why are we slowing down for the next 35 years? That’s about the same pace as we have seen over the last 20 years.
  • According to the Downtown Business Association’s most recent employee survey (PDF), just 6% of people who work downtown also live downtown. This despite downtown being one of our two biggest employment centres (the other being the University of Alberta, which is just a short LRT ride away).

So I don’t buy the argument that we need more people working downtown. If anything, we need more of the people who work downtown to choose to live there also. We need to want to make the changes downtown needs, and we need to make decisions that support that. If we want to meaningfully revitalize downtown, this picture has to change!

There’s a lot more to this discussion of course, but I find this to be a useful way to remind myself of the importance of residents. What do you think?

Sources: Municipal Census 2009, 2010 Downtown Resident Survey (PDF), 2010 Downtown Employee Survey (PDF), 2010 Business Recruitment Resource (PDF). The surveys come from the Downtown Business Association, and I used them to calculate the numbers in the graph. The times, 6am to 7pm, come from the Employee Survey. On weekdays, the green portion is essentially the number of people who both live and work downtown, which is an average of the 6% of employees who say they live downtown and the 29% of residents who say they work downtown. There are a bunch of assumptions made, of course, such as the assumption that if you’re a downtown resident and you don’t work downtown, you work and are somewhere else between 6am and 7pm.

Edmonton Neighbourhood Census Data

For a long time I’ve wanted to get the City of Edmonton’s neighbourhood census data in CSV format (or really any usable format other than PDF). Recently, with the help of Laura (and Sandra) at the City’s Election & Census Services department, who I met at the Open City Workshop, I finally got it. And now you can have it too!

Download the Edmonton Neighbourhood Census Data in CSV

I’ve also emailed this to the City’s open data team, so hopefully they can get it in the data catalogue soon.

Visualizing the Data

Why is having the census data in a format like CSV useful? Well for one thing, it enables creatives to do stuff with that data through code or other tools. For instance, I was able to generate a heat map for the City of Edmonton:

The darker sections are more heavily populated, the lighter yellow regions are less populated.

Not all neighbourhoods are reflected, as the City does not release details for neighbourhoods with a population between 1 and 49. Here are some other things we can learn from the data set:

  • Total population in the data set is 777,811, which means there are 4628 individuals unaccounted for (total for 2009 was 782,439).
  • The average neighbourhood population is 2424, or 3039 if you exclude neighbourhoods with a reported population of 0.
  • The median neighbourhood population is 2216.
  • Oliver and Downtown are the only two neighbourhoods with a population greater than 10,000.
  • More dwellings are owned (192,171) than rented (121,953).

ShareEdmonton

Another reason having this data in CSV is useful is because app developers can more easily integrate it into the things they are building. For example, all the census data is now available at ShareEdmonton! So when you view a neighbourhood, you’ll see the census data on the right side (see Alberta Avenue for example). You can also browse neighbourhoods by population. I’ve also fixed the neighbourhood search, so it works better now.

This is just the first of a few neighbourhood-related updates this month, so stay tuned for more!

Apps4Edmonton

Yesterday the City released more information on the Apps4Edmonton competition. The first phase, from now until May, is “accepting community ideas”. Basically they want you to tell them what data you want. Aside from the obvious “we don’t know what we don’t know” problem, I think the community has done a pretty good job of defining desired data sets already.

They City had a great start in January with the launch of the data catalogue, but we need more data. Especially data like the census data, which myself and many others have been asking for since the day the PDFs were released. There are clearly some internal issues that need to be worked out if I was able to acquire this before the open data team was. I hope they get everything resolved for the competition, because it’ll be a pretty boring one if we still only have twelve data sets (New York and other cities had dozens, maybe even hundreds, before their competitions).

That said, I know there are passionate, smart people working on it. Email opendata@edmonton.ca if you have data set requests or want to get involved in Apps4Edmonton.