The way to get a recession in Edmonton

John Rose, Chief Economist at the City of Edmonton, started his presentation at the Edmonton Real Estate Forum earlier this month with a bit of humor. “There are two kinds of forecasts,” he told the packed room. “Lucky and wrong!” He finished it on a much more serious note, saying “the way to get a recession in Edmonton is to have the provincial government make cuts.”

Edmonton Real Estate Forum

The general message from Rose was that because Edmonton’s economy is more diversified than Calgary’s or the rest of Alberta, we have handled the downturn better than those locations. “Lethbridge might be the only other jurisdiction that is less reliant on energy than Edmonton,” he said. But, there are reasons to be less optimistic about future growth.

Our unemployment rate went up during the economic downturn “primarily because our labour force grew faster than we could generate jobs,” Rose said, pointing to the increase in migration from other regions that fared worse. It has since gone down to 6.6% but that’s not necessarily a good thing. “The unemployment rate in Edmonton has been going down for exactly the wrong reason,” Rose said. Over 11,000 people have left the labour force in the last 12 months. “Nearly all the job gains we saw in 2017 have been eliminated in the first quarter” of 2018, Rose said. “Education, manufacturing, health care, and professional services have all gained jobs,” he said, while “trade, retail, public administration, transportation, and warehousing have all lost jobs” in the Edmonton area.

public sector employment

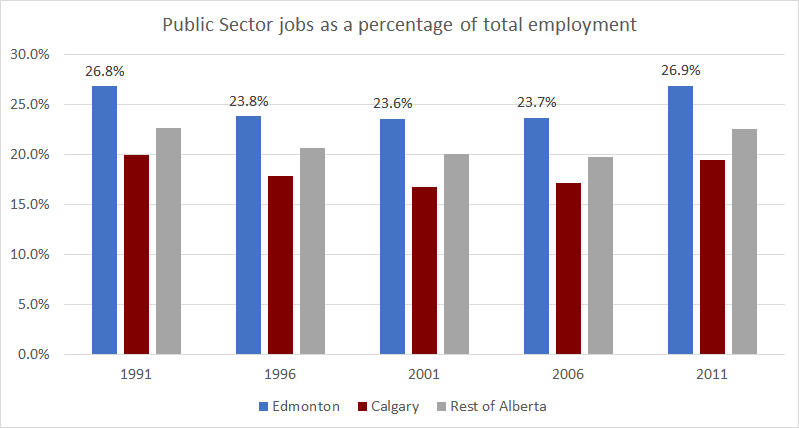
As the above chart shows, Edmonton’s public sector workers, which includes those in government, health, and education, make up about 25% of our workforce. The data hasn’t been updated yet for more recent years, but based on data from the 2016 census as well as the provincial Labour Force Statistics report for April 2018, I believe the trend holds.

You can see that the public sector makes up a larger part of Edmonton’s workforce compared with Calgary or the rest of the province. Which means that cuts to public administration, health care, or education hit Edmonton harder than the rest of the province.

So what’s a likely reason the government would need to make cuts? Though Edmonton may be diversifying away from oil, Alberta as a whole is still dependent.

Rose spoke for a while about the price of oil, and it’s impact on the province. “While we have seen North American and Global oil prices accelerate,” he said, “it is only recently that we have seen any benefit from that in Alberta.” He explained the difference between the Brent (the global benchmark price), WTI (the North American benchmark price), and WCS (the Alberta benchmark price), and noted the price discount we’re experiencing “due to export capacity constraints.”

WTI vs WCS

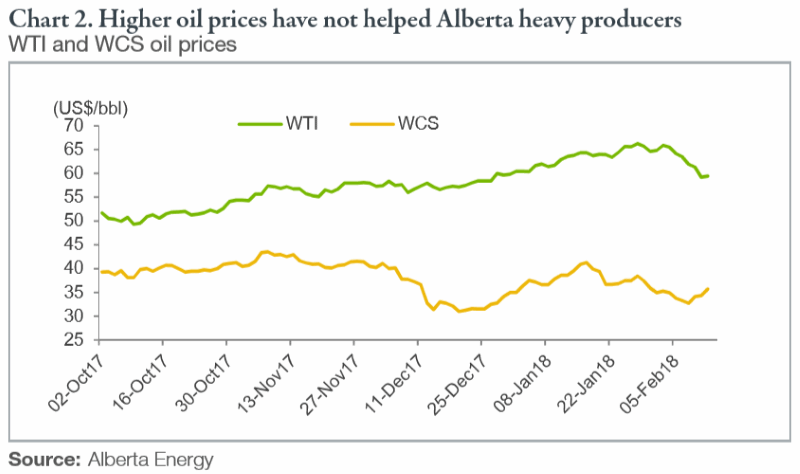
“We are now producing more oil than we can move due to limited capacity,” he said, “which is why the pipelines are so important.” Rose said he was shocked at the speed with which energy companies began to cut back due to the decline in oil prices a few years ago, in contrast with Ontario where he spent most of his career. There he said the economy is “much more like an ocean liner, it’s slow to turn.”

WTI vs WCS

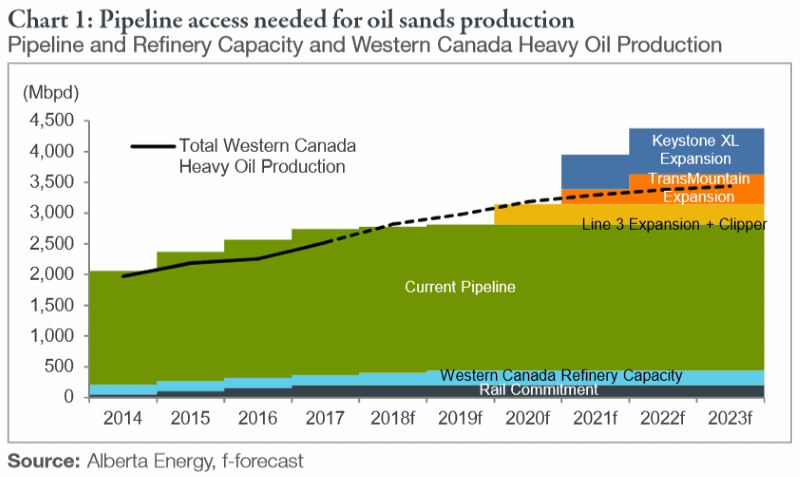
“Oil production in North America is at record levels,” Rose said, “and given our inability to move product out of Alberta, there’s a real risk of oil prices continuing to decline, which would put the provincial government in an even worse position.” That could force it to look to cut costs, which could have a very negative impact on Edmonton’s economy.

Provided that doesn’t happen, Rose expects Edmonton’s economy to do quite well. He expects the unemployment rate to continue to drift downward over the year. “Population growth will continue but at a slower rate,” he said. Vacancy rates at about 7% have driven rental rates down, and thanks to a potential overbuild of single family homes in 2015, “there might be too much inventory”, helping to keep prices in check. “Low inflation will boost real incomes for Edmonton residents as average weekly wages are rising again,” he said.

Rose forecasts that Edmonton and the region “will grow more rapidly than Alberta and Canada” through 2023. Let’s hope he’s lucky, not wrong.

The two oil-related charts above come from Alberta Energy. Canada is the fourth largest producer and third largest exporter of oil in the world, with the oil sands accounting for 62% of Canada’s oil production, according to Natural Resources Canada. There’s more on Alberta’s energy industry at the National Energy Board.

A look at Instagram usage in Edmonton

In this post I’m going to share some data on how Edmontonians are using Instagram1. This data was collected using the Instagram API over the 30 days between June 9 and July 8. My aim in this post is not to try to quantify every Instagram photo posted in Edmonton, but rather to give you a flavor of what Instagram usage looks like in our city.

instagram photos by day

During the month in question, I tracked 90,679 total photos posted by 15,395 different users. The average number of photos posted per user was 6, while the median number was 3. Just 4 users posted more than 200 photos over the month, while 25 users posted 100 photos or more.

Filters

One of the things I was most interested in was filter usage. Which filters are the most popular? It turns out that 59% of all photos posted did not use a filter at all! Here’s the breakdown:

instagram photos by filter

The top five filters were: Amaro, Valencia, Mayfair, X-Pro II, and Lo-Fi.

Likes & Comments

I tracked the number of likes & comments posted on each photo for a short period of time only, so some may have accumulated more over the course of the month than I captured. A total of 15,825 photos or 17.5% received no likes, while just over 64,000 or 70.7% received no comments.

instagram photos by likes

The average number of likes a photo received was 13, and the average number of comments received was less than 1. One photo received more than 4,000 likes and one received more than 260 comments.

Tags

Here’s a tag cloud of all the tags used on the photos posted during the month:

instagram photo tags

Here are the top 25 tags used:

  1. yeg
  2. love
  3. edmonton
  4. summer
  5. cute
  6. instagood
  7. follow
  8. photooftheday
  9. followme
  10. beautiful
  11. selfie
  12. tagsforlikes
  13. tbt
  14. like4like
  15. girl
  16. happy
  17. smile
  18. picoftheday
  19. canada
  20. instadaily
  21. tflers
  22. food
  23. likeforlike
  24. amazing
  25. bestoftheday

Roughly 40,252 or 44% of the photos posted did not have any tags.

Neighbourhoods

One of the interesting things about Instagram photos is that they are geotagged. That means I was able to see where in the city they were posted. A total of 349 neighbourhoods had at least one photo posted. Here are the top 25 neighbourhoods by number of photos posted:

  1. Downtown
  2. Oliver
  3. Strathcona
  4. University of Alberta
  5. Garneau
  6. Queen Alexandra
  7. Summerside
  8. Westmount
  9. Cumberland
  10. Queen Mary Park
  11. Boyle Street
  12. Ritchie
  13. Summerlea
  14. McCauley
  15. Central McDougall
  16. Edmonton Northlands
  17. Brintnell
  18. Rutherford
  19. River Valley Victoria
  20. Inglewood
  21. Alberta Avenue
  22. South Edmonton Common
  23. Silver Berry
  24. MacEwan
  25. Ormsby Place

Here’s a rough look at some of the data on a map:

neighbourhoods

The top 5 neighbourhoods accounted for 19.1% of all the photos posted.

Final Thoughts

I hope you found this look at Instagram usage in Edmonton useful! Remember, this is not meant to quantify usage, but rather is intended to give you a sense of the way Instagram is used throughout our city. Obviously it would be interesting to analyze what exactly is being posted on Instagram, but that kind of analysis is much more complicated.

Happy Instagramming!


  1. It would be more accurate to say this is a look at photos posted in Edmonton. To gather the data, I asked the Instagram API for photos posted within the limits of the City of Edmonton. While most of those were likely posted by residents, some would have been from tourists or other visitors. 

State of the Edmonton Twittersphere 2013: Top Users & Tools

In case you missed it, check out the overview post for a general look at Twitter in Edmonton in 2013. In this entry I’ll share more details on who the most active, replied to, and retweeted users of the year were. If you want to see the most followed users in Edmonton, check out Twopcharts. Taylor Hall is the first local user over 300,000 followers!

A quick reminder that the data in this post comes from a sample of roughly 13.8 million tweets posted by local users as defined in the overview post. Nearly 120,000 local users posted at least one tweet in 2013.

Here are the 25 most active local users (they tweeted more than anyone else):

  1. RPrasad619
  2. DaniParadis
  3. KikkiPlanet
  4. DavidPapp
  5. canadianglen
  6. Leask
  7. TrevorBoller
  8. YEGlifer
  9. JovanHeer
  10. abdihalimsalad
  11. MyLegacyCoach
  12. HouseofGlib
  13. ChristySpratlin
  14. bcbreakaway
  15. markyeg
  16. Moesquare
  17. edmontonjournal
  18. 1023nowradio
  19. machinegunv
  20. DJ_Orphan
  21. Gloriadantuono
  22. tommylutz
  23. eissyrC
  24. ctvedmonton
  25. candyTae

There were three easily-identifed bots that would have been in the list above:

  1. edmonton_rt
  2. EdmontonCP
  3. HOT107OD

Here are the 25 most active local users using #yeg (they tweeted using the #yeg hashtag more than anyone else):

  1. ctvedmonton
  2. GlobalEdmonton
  3. CBCEdmonton
  4. iNews880
  5. 925FreshFM
  6. mybirdietweets
  7. edmontonjournal
  8. 1049VirginYEG
  9. DerrickDodgeYeg
  10. metroedmonton
  11. RobWilliamsCTV
  12. KikkiPlanet
  13. Dave_CHED
  14. Edmontonsun
  15. Yegfit
  16. YEGFoodie
  17. vineshpratap
  18. EJ_Arts
  19. JBH8
  20. lindork
  21. lite957
  22. DishcrawlYEG
  23. Sperounes
  24. 1023nowradio
  25. YEGlifer

There were four bots that tweeted enough to be in that list above:

  1. edmonton_rt
  2. EdmCA
  3. everythingyeg
  4. yegtraffic

Here are the 25 most replied to local users (other local users had lots of conversations with these users):

  1. KikkiPlanet
  2. EdmontonOilers
  3. JasonGregor
  4. nielsonTSN1260
  5. YEGlifer
  6. Leask
  7. TrevorBoller
  8. CommonSenseSoc
  9. JenBanksYEG
  10. eissyrC
  11. Wildsau
  12. DeeMented2
  13. Kage_99
  14. britl
  15. JameyMPhoto
  16. erinklassen
  17. dantencer
  18. lindork
  19. dstaples
  20. baconhound
  21. Steeeveohh
  22. joshclassenCTV
  23. JackieDee16
  24. Arbitral
  25. edmontonjournal

Here are the 25 most retweeted non-individual local users:

  1. edmontonjournal
  2. ctvedmonton
  3. globaledmonton
  4. cityofedmonton
  5. cbcedmonton
  6. edmontonoilers
  7. yegsphere
  8. yegtraffic
  9. localgoodyeg
  10. oilersnation
  11. edmoilkings
  12. edmontonpolice
  13. yegtweetup
  14. metroedmonton
  15. whereedmonton
  16. edmontonsun
  17. ualberta
  18. 925freshfm
  19. cisncountry
  20. inews880
  21. cfl_esks
  22. 1049virginyeg
  23. northlands
  24. nait
  25. oldstrathcona

Here are the 25 most retweeted individual local users:

  1. kikkiplanet
  2. dantencer
  3. jasongregor
  4. joshclassenctv
  5. fakeoilersgm
  6. paulatics
  7. doniveson
  8. mastermaq
  9. cstpower
  10. nielsonTSN1260
  11. sunterryjones
  12. sbarsbyweather
  13. wanyegretz
  14. etownmickey
  15. ryanjespersen
  16. britl
  17. davecournoyer
  18. lindork
  19. trevorboller
  20. dstaples
  21. ebs_14
  22. robin_brownlee
  23. yeglifer
  24. staceybrotzel
  25. geneprincipe

Clearly if you tweet about the Oilers, there’s a good chance you’re going to get retweeted. I’m fascinated by the fact that a satirical account, @FakeOilersGM, is the fifth most retweeted individual. Shows you what kind of year the Oilers have had, and how engaged Edmontonians are with the Oilers.

Only the Edmonton Journal was retweeted more than 10,000 times. A total of 88 users were retweeted more than 1000 times, 1547 users were retweeted more than 100 times, and nearly 11,000 users were retweeted at least 10 times.

Tools

The ten most popular tools or clients used to tweet in 2013 accounted for 84% of all local tweets. The top 25 accounted for just less than 93% of all tweets. There’s definitely a long tail here though, as more than 3300 different clients were used.

  1. Twitter for iPhone
  2. web
  3. Twitter for Android
  4. Twitter for BlackBerry®
  5. TweetDeck
  6. Twitter for iPad
  7. HootSuite
  8. Facebook
  9. Instagram
  10. Tweet Button

Here’s a look at the breakdown:

Tweets by Client (2013)

No surprise to see BlackBerry fall down below Android, but I must admit I am a little surprised it remains so high on the list.

You can see the top users & tools from previous years here: 2012, 2011, 2010, 2009.

Happy Tweeting!

State of the Edmonton Twittersphere 2013: Overview

Welcome to the State of the Edmonton Twittersphere for 2013, my fifth look at the intersection of Twitter and Edmonton. You can see my previous annual recaps here: 2012, 2011, 2010, 2009.

In previous years, I have more or less treated the reports as connected to one another. I’d capture nearly every tweet posted by local users over the year, and compare the data to previous years, and you’d see the growth. This year is different. Twitter made changes to the part of its system that I use to gather the data, so instead of gathering most of the data, I instead was only able to gather a large sample.

The sample for this year’s report is about 13.8 million tweets posted by local users. Local users are defined the same way as before: if a user has his or her location set to Edmonton, St. Albert, Sherwood Park, Leduc, Nisku, Stony Plain, Fort Saskatchewan, Beaumont, Spruce Grove, or matching lat/long coordinates, they are considered an Edmontonian, and thus a “local user”.

Of the 13.8 million tweets in this year’s sample:

  • Just under 800,000 or 5.7% were tagged #yeg.
  • More than 950,000 or 6.9% were retweets.
  • About 5.1 million or 37.2% were replies.
  • Roughly 1.2 million or 9.1% were replies to other local users.
  • Nearly 3.2 million or 23.2% contained links.
  • More than 640,000 or 4.7% were twooshes (exactly 140 characters).

Tweets by Type (2013)

In 2013, the day of the week with most tweets posted was Wednesday, which is consistent with previous years. Sunday and Saturday saw the fewest tweets posted.

Tweets by Type (2013)

Local users used over 840,000 different hashtags in 2013. As usual, hashtags ranged in length from 1 character to 139, excluding the hash, and they were used for just about every purpose you can think of. The average hashtag length was 13 characters.

Here are the top 25 hashtags used by local users in 2013:

  1. #yeg
  2. #oilers
  3. #edmonton
  4. #yegfood
  5. #yegvote
  6. #ableg
  7. #cdnpoli
  8. #yyc
  9. #shpk
  10. #yegwx
  11. #jobs
  12. #yegcc
  13. #nhl
  14. #ff
  15. #yegtraffic
  16. #stalbert
  17. #yegdt
  18. #ualberta
  19. #yegarts
  20. #cbc
  21. #yegweather
  22. #whatshouldplaynext
  23. #teamfollowback
  24. #instantfollowback
  25. #canada

Here’s a visualization of the top 100 hashtags excluding #yeg:

Top Hashtags for 2013

It’s no surprise that #yeg was once again the most popular hashtag, by far. Twitter even declared #yeg as the second most popular trend in Canada for the year. In total, there were 4,611 different hashtags starting with #yeg used by local users in 2013.

Here are the top 25 #yeg-related hashtags:

  1. #yeg
  2. #yegfood
  3. #yegvote
  4. #yegwx
  5. #yegcc
  6. #yegtraffic
  7. #yegdt
  8. #yegarts
  9. #yegweather
  10. #yegarena
  11. #yegmusic
  12. #yegjobs
  13. #yegbike
  14. #yegre
  15. #yegevents
  16. #yegfashion
  17. #yegbiz
  18. #yegfringe
  19. #yegtheatre
  20. #yegtransit
  21. #yegfilm
  22. #yegmedia
  23. #yegpkn
  24. #yegbeer
  25. #yegsa

Here’s a visualization of the top 100 #yeg-related hashtags:

Top #yeg Hashtags for 2013

No surprise that #yegfood remained on top (after #yeg of course) and I suppose it shouldn’t be surprising that in an election year, #yegvote was quite popular. Interesting to me that #yegjobs is so high, but I suppose that could be due to bots or automated tweets.

I’ll have additional data to share in my next post, which will include the most active, replied to, and retweeted users of the year.

Happy Tweeting!

Edmonton’s International Airport is well-positioned for growth in 2014 and beyond

Last year was a good one for the Edmonton International Airport (EIA) with a record-breaking 6.9 million passengers served. Additionally, corporate charter flights from the private terminals increased 30%.

“These record-breaking numbers show that Edmonton International Airport completed its expansion just in time. EIA is a not-for-profit corporation that works for the benefit of our region. To foster economic growth, both air service and our airport facilities must keep pace with demand from our region,” said EIA Vice President of Passenger Market Development Traci Bednard.

There were other positives in 2013 too. Non-stop service to New York City began in May, the new NAV CANADA Air Traffic Control Tower began operations in the spring, Icelandair announced service between Edmonton and Reykjavik, and a new Dallas/Fort Worth flight was announced.

New EIA Air Traffic Control Tower

According to EIA itself, 2013 was its second straight record-breaking year, following strong increases in 2011 and 2012 (other statistics are available here). Thing is, air traffic is up around the world, and EIA wasn’t the only airport to report a record-breaking 2013; Montreal’s Trudeau Airport, the Victoria International Airport, and dozens of international airports did as well. Many others have yet to report figures. I wanted to see EIA’s growth in context, so I went to Statistics Canada to get the data.

Here’s a look at EIA’s passenger traffic growth since 1995 (using data from Statistics Canada, except for 2013, which comes from EIA directly):

eia passenger traffic

Here’s what the year-over-year change has looked like in that same period:

eia passenger traffic change

The massive spike in 1996 was of course due to the consolidation of scheduled service at EIA. In the 2001-2003 period, after 9/11, EIA experienced a slowdown in traffic just as airports everywhere did. Since then, EIA has grown significantly, from about 3 million passengers a year to nearly 7 million in 2013.

I wondered what EIA’s passenger traffic growth has looked like compared with other airports in Canada. Again using figures from Statistics Canada, here’s a look at ten Canadian airports:

airport passenger traffic

What stands out for me is that EIA broke away from the pack in the mid-2000s to become the clear #5 airport behind Toronto, Vancouver, Montreal, and Calgary. There was a slowdown in growth between 2008 and 2010, but EIA seems to have turned things around.

Though passengers are the metric we often think of, aircraft movements is another that is useful to track. One movement is a landing or takeoff of an aircraft and an itinerant movement is essentially a flight from one airport to another. Here’s a look at the itinerant movements for the same airports:

airport movements

Here EIA isn’t as clearly the #5 airport, though it has moved up significantly from the mid-2000s and is now approaching 300,000 itinerant movements per year.

Expansion 2012

If current trends continue, EIA should finally break the 7-million-passengers-per-year milestone in 2014, and the airport’s prospects for growth beyond that look encouraging. I certainly feel that the Expansion 2012 project has resulted in a more attractive, functional airport, and the numbers seem to support that. It’s also a similar sentiment that I often hear Edmontonians express. They’re proud of the airport now, whereas they weren’t before. Future expansion plans will not only add capacity, but will also bring a new hotel and an outlet shopping mall to EIA. And certainly Edmonton’s hot economy will continue to push usage ever higher. Altogether, it makes the outlook for EIA look very good indeed.

For more on EIA’s impressive 2013, check out the press release here.

What happens if there’s a tie on October 21?

A few weeks ago I ran into the amazing Linda Hut, the teacher and coordinator over at City Hall School, and she mentioned that her class was asking questions about the election. One student asked what would happen if there was a tie. The answer, which can be found in the Local Authorities Election Act (Section 99), might surprise you:

If it appears on the calculation of the votes that 2 or more candidates for any office have received the same number of votes, and if it is necessary for determining which candidate is elected, the returning officer shall write the names of those candidates separately on blank sheets of paper of equal size and of the same colour and texture, and after folding the sheets of paper in a uniform manner and so that the names are concealed, shall deposit them in a receptacle and direct some person to withdraw one of the sheets, and the returning officer shall declare the candidate whose name appears on the withdrawn sheet to have one more vote than the other candidate.

That’s right, months of campaigning and the decision could all come down to one piece of paper drawn from a hat. Fortunately, the chance of a tie happening is pretty tiny!

To start, what’s the likelihood that all six mayoral candidates could receive the same number of votes? Well, technically it’s impossible as there are 619,138 eligible voters, but let’s round that up to 619,140 for the sake of argument. That would mean each candidate would need to get 103,190 votes exactly for all six to be tied. According to Wolfram Alpha, there’s a 1 in 735 chance (about 0.14%) of a candidate getting that number. If we reduce that to just the 34% of voters that actually turned up last election, the chances improve slightly to 1 in 429 (about 0.23%). But actually, that has to happen six times in order for all of them to tie, which is just incredibly unlikely.

Now that’s a fairly unrealistic scenario as we know that there are a lot of factors that make it unlikely our full slate of mayoral candidates will all receive the same support. In the 2010 election, the top three candidates (out of seven) received about 95% of the vote. So let’s assume this year’s election will be similar. Continuing on with the 34% turnout, there would be 199,983 votes up for grabs by the top three. The chance that a candidate will get exactly one third of those votes is about 1 in 528 (0.19%). And the odds that all three will tie? Again, it’s not going to happen.

What if one of the three receives a quarter of the vote and the other two split the remaining votes? The likelihood of that is much better than a three-way tie at about 1 in 485 (0.21%), but still, it’s just very unlikely!

With the number of votes we’re talking about, ties are just not very realistic. Even assuming 34% turnout in Ward 9 where there are just two candidates, there’s still a less than 1% chance of a tie (1 in 178, 0.56%).

This is all just simple math for the purposes of illustration, and it ignores the many, many factors that go into why someone will vote for candidate A over candidate B. Still, now you know how unlikely a tie is!

State of the Edmonton Twittersphere 2012 – Hashtags & Links

This is the third part in my State of the Edmonton Twittersphere for 2012 – you can read the overview post here (and here is the hashtags & links entry for 2011). As we saw in that entry, local users posted more than 4 million tweets containing links. They also posted nearly 5 million tweets containing hashtags. Let’s take a closer look at what exactly we tweeted about in 2012.

It’s difficult to extract a lot value out of links because everything is trapped behind the t.co wrapper, but I did want to highlight the time of day that links seem to be posted. Recall that the hourly peak for tweet volume in general comes at around 9 PM, whereas for tweets containing links the peak is 11 AM.

Local users used just over 1 million different hashtags in 2012, up from nearly 600,000 in 2011. Hashtags ranged in length from 1 character to 139, excluding the hash, and they were used for just about every purpose you can think of. The average hashtag length was 14 characters.

Here are the top 25 hashtags used by local users in 2012:

  1. #yeg
  2. #ableg
  3. #yegfood
  4. #oilers
  5. #abvote
  6. #edmonton
  7. #ff
  8. #cdnpoli
  9. #yyc
  10. #yegwx
  11. #jobs
  12. #wrp
  13. #nhl
  14. #yegarts
  15. #ualberta
  16. #shpk
  17. #yegtraffic
  18. #yegweather
  19. #yegcc
  20. #yegdt
  21. #yegmusic
  22. #cbc
  23. #stalbert
  24. #yegarena
  25. #fb

Here’s a visualization of the top 100 hashtags excluding #yeg:

The most popular hashtag of all is still #yeg by a long shot. It was used about 660,000 times by local users which works out to 13.4% of all local tweets containing hashtags. The list above also illustrates the prevalence of #yeg-related hashtags. In 2012, local users used more than 4200 of them, up from 3600 last year. Though half of them were used just once, 44 #yeg-related hashtags were used more than 1000 times each.

Here are the top 25 #yeg-related hashtags:

  1. #yegfood
  2. #yegwx
  3. #yegarts
  4. #yegtraffic
  5. #yegweather
  6. #yegcc
  7. #yegdt
  8. #yegmusic
  9. #yegarena
  10. #yegre
  11. #yegjobs
  12. #yegwxfx
  13. #yegtransit
  14. #yegfringe
  15. #yegtheatre
  16. #yegfoodag
  17. #yegctvml
  18. #yegfilm
  19. #yegbike
  20. #yegfashion
  21. #yegmedia
  22. #yegbeer
  23. #yegpets
  24. #yeggeek
  25. #yegwine

Here’s a visualization of the top 100 #yeg-related hashtags:

I noticed some trends looking at the top 100 hashtags, so I decided to group some tags into topics or categories. I came up with nine that stood out:

  • Arts – #yegarts, #yegfringe, #yegmusic, #yegtheatre, #yegfilm
  • Downtown – #yegdt, #yegarena
  • Education – #abed, #edtech, #ualberta, #epsb
  • Food – #yegfood, #yegfoodag
  • Politics – #yegcc, #ableg, #cdnpoli, #abpoli, #yegfed
  • Regions – #shpk, #sprucegrove, #stalbert, #fortsask, #strathco, #leduc
  • Sports –#oilers, #nhl, #esks, #cfl, #oilkings
  • Transportation – #yegtraffic, #yegtransit, #yegbike
  • Weather – #yegweather, #yegwx, #yegwxfx

Here’s a breakdown of how those categories relate to one another. You can see that we tweet more about politics and sports than arts and education:

Here’s a look at the frequency of each category over the course of the year. This starts to show some interesting variations over the year, most notably in the summer when we experience our nicest weather and the Fringe Festival is taking place:

And here’s that same frequency but highlighting the spikes that took place throughout the year:

I’d love to hear your ideas for what those spikes represent, but here are my guesses for a few of them:

  • Sports – April 10, 2012 – This was the day the Oilers won the lottery for the first overall draft pick.
  • Education – June 15, 2012 – This was the day of the HUB Mall shooting.
  • Sports – June 22, 2012 – This was the day the Oilers selected Nail Yakupov first overall at the 2012 NHL Entry Draft.
  • Arts – August 17, 2012 – This was the day after the Fringe started and was the day of the Metallica concert.
  • Downtown – October 17, 2012 – This was the day of the Downtown Arena update (Mandel’s deadline for the Katz Group).
  • Food – October 26, 2012 – This was the day of the public hearing on the Food & Agriculture Strategy.
  • Transportation/Weather – November 7, 2012 – This was the day of our first major snowfall.
  • Politics – December 12, 2012 – This was the day Council voted to re-open negotiations with the Katz Group on the arena.

You might be wondering about the provincial election that took place in April. Well I originally included #abvote in the Politics category, but it skewed the results so dramatically I took it out. Here’s what it the year looks like if you include #abvote:

April 23 was election day, and local users posted more tweets on that day than any other until the snowstorm came along and on November 6 and 7. In addition to those two days, just one other day in 2012 had more tweets than election day and that was December 12 when Council last discussed the arena.

This entry brings my 2012 report to a close. I hope you found it useful – thanks for reading!

2012 in Review

  1. Overview
  2. Users & Clients
  3. Hashtags & Links

State of the Calgary Twittersphere – Hashtags & Links

This is the third part in my State of the Calgary Twittersphere for 2012 – you can read the overview post here. As we saw in that entry, local users posted more than 5 million tweets containing links. They also posted about 5 million tweets containing hashtags. Let’s take a closer look at what exactly they tweeted about in 2012.

It’s difficult to extract a lot value out of links because everything is trapped behind the t.co wrapper, but I did want to highlight the time of day that links seem to be posted. Recall that the hourly peak for tweet volume in general comes at around 9 PM, whereas for tweets containing links the peak is 11 AM.

Local users used about 1.1 million different hashtags in 2012. Hashtags ranged in length from 1 character to 139, excluding the hash, and they were used for just about every purpose you can think of. The average hashtag length was 14 characters.

Here are the top 25 hashtags used by local users in 2012:

  1. #yyc
  2. #calgary
  3. #abvote
  4. #jobs
  5. #flames
  6. #ableg
  7. #ff
  8. #cdnpoli
  9. #porn
  10. #xxx
  11. #yeg
  12. #job
  13. #stampede100
  14. #wrp
  15. #rent
  16. #yyccc
  17. #win
  18. #oilrigjobs
  19. #nhl
  20. #love
  21. #yycre
  22. #cfl
  23. #canada
  24. #sceneyyc
  25. #giveaway

Here’s a visualization of the top 100 hashtags excluding #yyc:

The most popular hashtag of all is still #yyc, followed by #calgary (#yyc is about 6 times more popular than #calgary). In total, #yyc was used about 600,000 times by local users which works out to 11.9% of all local tweets containing hashtags.

Though not as prevalent in the top 100, local users did use #yyc-related hashtags quite frequently. In total, about 2500 different hashtags were used that start with #yyc. A little more than half of those were used just once, and just 22 were used 1000 times or more.

Here are the top 25 #yyc-related hashtags:

  1. #yyccc
  2. #yycre
  3. #yycbike
  4. #yyccentre
  5. #yyctraffic
  6. #yycfood
  7. #yycarts
  8. #yyctransit
  9. #yycbe
  10. #yycplan
  11. #yycfoodtrucks
  12. #yycscan
  13. #yycjobs
  14. #yycmusic
  15. #yycse
  16. #yycweather
  17. #yycsocent
  18. #yycpkn
  19. #yyceats
  20. #yycfashion
  21. #yycsw
  22. #yycnw
  23. #yyccrime
  24. #yycfilm
  25. #yycklein

Here’s a visualization of the top 100 #yyc-related hashtags:

This entry brings my 2012 report to a close. I hope you found it useful – thanks for reading!

2012 in Review

  1. Overview
  2. Users & Clients
  3. Hashtags & Links

State of the Edmonton Twittersphere 2012 – Users & Clients

This is the second part in my State of the Edmonton Twittersphere for 2012 – you can read the overview post here (and here is the users & clients post for 2011). As we saw in that entry, more than 105,000 local users posted at least one tweet in 2012. Let’s take a closer look at users and the tools they used to post tweets.

While a large number of users posted at least one tweet throughout the year, there are fewer users who post something in any given month. Keeping in mind that November is underrepresented in this chart, we can see that October had the most active users at nearly 52,000, and the trend is very clearly going up.

Again I think it is really interesting to look at this data over the longer term. Here’s a look at the growth in monthly active users since I started tracking data in 2009:

There are a small number of really active users, and a much larger number of less active users. In 2012, the top 100 most active users accounted for about 1.5 million or 8.8% of all local tweets (that’s down from 16% in 2011).

Here are the 25 most active users:

  1. MadMissee
  2. KikkiPlanet
  3. theleanover
  4. rootnl2k
  5. JameyMPhoto
  6. JovanHeer
  7. markyeg
  8. TrevorBoller
  9. Klayoven
  10. CommonSenseSoc
  11. prabhjots5
  12. Leask
  13. canadianglen
  14. edmontonjournal
  15. Walleedj
  16. PetitMonstre77
  17. alannafletcher
  18. AskMartyMisner
  19. ZoomJer
  20. MandaTRT
  21. jmschow
  22. DerrickDodgeYeg
  23. Pokerclack
  24. YEGlifer
  25. scottyos

Here are the 5 most active bots or automated feeds:

  1. EdmontonBizcaf
  2. GCAccess
  3. yegtraffic
  4. EdmCa
  5. yegwx

Combined, the top 30 users accounted for about 4.6% of all local tweets (down from 8.3% last year).

Here are the 25 most active users using #yeg:

  1. ctvedmonton
  2. DerrickDodgeYeg
  3. CBCEdmonton
  4. iNews880
  5. metroedmonton
  6. Edmontonsun
  7. edmontonjournal
  8. JBH8
  9. 1049VirginYEG
  10. RobWilliamsCTV
  11. GlobalEdmonton
  12. JOEFM
  13. lindork
  14. MaddCashFS
  15. 1023nowradio
  16. BTEdmonton
  17. OFSS1969
  18. SpontainRichFS
  19. TrevorBoller
  20. oldstrathcona
  21. KikkiPlanet
  22. EJ_Arts
  23. DebraWard
  24. artrubicon
  25. CommonSenseSoc

Here are the 5 most active bots or automated feeds using #yeg:

  1. EdmCa
  2. yegwx
  3. yegsphere
  4. yegtraffic
  5. hiresuccessjobs

The top 100 most active users using #yeg and related tags accounted for 1.4% of all local tweets, and 25.8% of all #yeg-tagged tweets, down from 30.3% last year.

Here are the 25 most replied to users (by other local users):

  1. KikkiPlanet
  2. JenBanksYEG
  3. JasonGregor
  4. nielson1260
  5. JameyMPhoto
  6. ZoomJer
  7. TrevorBoller
  8. Leask
  9. CommonSenseSoc
  10. britl
  11. YEGlifer
  12. Pokerclack
  13. Wildsau
  14. EdmontonOilers
  15. baconhound
  16. Luzzara
  17. BigAddie
  18. theleanover
  19. dantencer
  20. CopperTopper_85
  21. dstaples
  22. bananaramafoFin
  23. lindork
  24. Kristinnuendo
  25. amvanimere

Those 25 users accounted for 8.3% of all local replies, down from 11.2% last year. The top 100 most replied to local users accounted for 2.7% of all local tweets and 18.7% of all local replies (compared to 24.5% last year).

I think the retweet is one of the most valuable metrics on Twitter. Anyone can post a lot, or gain a lot of followers, but to get retweeted by lots of other people you need to be useful/interesting/funny/inspiring/etc. In the past I have just produced one list of the most retweeted users, but this year I decided to separate individuals from organizations.

Here are the 25 most retweeted non-individual users:

  1. edmontonjournal
  2. ctvedmonton
  3. EdmontonOilers
  4. metroedmonton
  5. CBCEdmonton
  6. GlobalEdmonton
  7. yegtraffic
  8. CityofEdmonton
  9. EdmOilKings
  10. Edmontonsun
  11. edmontonpolice
  12. HopeMission
  13. UAlberta
  14. EdmontonHumane
  15. iNews880
  16. CISNCountry
  17. AvenueEdmonton
  18. cfl_esks
  19. EJ_Extra
  20. oldstrathcona
  21. BlitzEdmonton
  22. TBSonK97
  23. sonic1029
  24. DerrickDodgeYeg
  25. FlyEIA

Here are the 25 most retweeted individual users:

  1. KikkiPlanet
  2. Paulatics
  3. mastermaq
  4. dantencer
  5. JasonGregor
  6. hallsy04
  7. joshclassenCTV
  8. CstPower
  9. ryanjespersen
  10. dstaples
  11. britl
  12. davecournoyer
  13. TrevorBoller
  14. lindork
  15. VassyKapelos
  16. sunterryjones
  17. ebs_14
  18. SBarsbyweather
  19. ChrisTse_
  20. nielson1260
  21. Wildsau
  22. GenePrincipe
  23. JameyMPhoto
  24. etownmickey
  25. bingofuel

A total of 59 users were retweeted by other local users 1000 times or more. Just 7 users were retweeted more than 5000 times, and @KikkiPlanet was the only individual in that group. Just like last year, only @EdmontonJournal was retweeted more than 10,000 times.

I did not keep track of the most followed users this year, primarily because the information is readily available elsewhere. If you want to know who the most followed users in Edmonton are, check out Twopcharts.

Clients

More than 3800 different applications and services were used to post tweets in 2012, up slightly from more than 3100 last year. For the first time since I have been tracking stats, the web is no longer the top dog! Here are the top ten:

  1. Twitter for iPhone
  2. web
  3. Twitter for BlackBerry®
  4. Twitter for Android
  5. TweetDeck
  6. HootSuite
  7. Instagram
  8. Facebook
  9. Tweet Button
  10. Echofon

The top ten clients accounted for 82.9% of all local tweets posted in 2012 (compared to 76.8% last year).

Coming Up

  1. Overview
  2. Users & Clients
  3. Hashtags & Links

State of the Calgary Twittersphere 2012 – Users & Clients

This is the second part in my State of the Calgary Twittersphere for 2012 – you can read the overview post here. As we saw in that entry, more than 105,000 local users posted at least one tweet in 2012. Let’s take a closer look at users and the tools they used to post tweets.

While a large number of users posted at least one tweet throughout the year, there are fewer users who post something in any given month. Keeping in mind that November is underrepresented in this chart, we can see that October had the most active users at nearly 60,000, and the trend is very clearly going up.

There are a small number of really active users, and a much larger number of less active users. In 2012, the top 100 most active users accounted for about 1.7 million or 9.0% of all local tweets.

Here are the 25 most active users:

  1. izzynobre
  2. GeekyLyndsay
  3. twiggy_hot
  4. xoTalim
  5. GeneralTekno
  6. BradWardLive
  7. SarahMcGuireJB
  8. WestJet
  9. TK0N
  10. dead__last
  11. CameraguyRob
  12. longdoglover
  13. RebTheCatSitter
  14. MusicMunchkin
  15. misskatsuragi
  16. a_picazo
  17. YorchCalgarian
  18. annemaccat
  19. TonyCosens
  20. lisawest99
  21. Paradise5551
  22. Wavefronttech
  23. candacemountain
  24. monaSinging
  25. PrimeBane

Here are the 5 most active bots or automated feeds:

  1. Remodelit_RADIO
  2. CalgaryBizcaf
  3. econewsbits
  4. HeraldHeadlines
  5. righelp

Combined, the top 30 users accounted for about 5.1% of all local tweets.

Here are the 25 most active users using #yyc:

  1. annemaccat
  2. ciawesome
  3. CTVCalgary
  4. CalgaryCommute
  5. metrocalgary
  6. calgaryherald
  7. BikeBikeYYC
  8. redgypsee
  9. OpenFileCGY
  10. 660NewsTraffic
  11. CTVMorningYYC
  12. ireneerutema
  13. markusoff
  14. LisaOstrikoff
  15. CalgaryREMAX
  16. 660News
  17. cityofcalgary
  18. knoppolis
  19. GlobalCalgary
  20. daxjustin
  21. collenbe
  22. LoGoDNB
  23. zoeywrites
  24. kahanelaw
  25. VogueCalgary

Here are the 5 most active bots or automated feeds using #yyc:

  1. CgyCa
  2. DailyDealsCGY
  3. mk_it_solutions
  4. Calgary_News
  5. BestDealCalgary

The top 100 most active users using #yyc and related tags accounted for less than 1.0% of all local tweets, and 24.8% of all #yyc-tagged tweets.

Here are the 25 most replied to users (by other local users):

  1. nenshi
  2. calgarytransit
  3. X929
  4. Fan960Steinberg
  5. antipretty_yyc
  6. lonnietaylor
  7. NHLFlames
  8. Eves1
  9. danellew
  10. Diegirl
  11. lubeyisms
  12. annemaccat
  13. maniacalmom
  14. CassieNeil
  15. DarciBrianne
  16. MisterYYC
  17. myownbiggestfan
  18. dinnerwithjulie
  19. buzzbishop
  20. WestJet
  21. WeebDaCat
  22. lisawest99
  23. doglover100
  24. redgypsee
  25. fan960walker

Those 25 users accounted for 7.2% of all local replies. The top 100 most replied to local users accounted for 1.5% of all local tweets and 15.2% of all local replies.

I think the retweet is one of the most valuable metrics on Twitter. Anyone can post a lot, or gain a lot of followers, but to get retweeted by lots of other people you need to be useful/interesting/funny/inspiring/etc.

Here are the 25 most retweeted non-individual users:

  1. calgaryherald
  2. CBCCalgary
  3. CTVCalgary
  4. metrocalgary
  5. cityofcalgary
  6. NHLFlames
  7. 660News
  8. GlobalCalgary
  9. AvenueMagazine
  10. ciawesome
  11. calgarysun
  12. calstampeders
  13. calgarytransit
  14. CalgaryPoker
  15. X929
  16. WestJet
  17. VolunteerCal
  18. calgarypolice
  19. calgarystampede
  20. downtowncalgary
  21. OpenFileCGY
  22. CTVMorningYYC
  23. calgary
  24. Calgary_News
  25. BikeBikeYYC

Here are the 25 most retweeted individual users:

  1. nenshi
  2. markusoff
  3. buzzbishop
  4. mikesbloggity
  5. ericfrancis
  6. DonBraid
  7. MisterYYC
  8. lonnietaylor
  9. Crackmacs
  10. dansgoodside
  11. LisaOstrikoff
  12. dinnerwithjulie
  13. TheoFleury14
  14. codyincalgary
  15. espyexperience
  16. ctvtoddgallant
  17. Fan960Steinberg
  18. sunrickbell
  19. CoryBMorgan
  20. paul_dunphy
  21. daxjustin
  22. socialgrrrl
  23. jayemkayem
  24. theturner
  25. a_picazo

A total of 44 users were retweeted by other local users 1000 times or more. Just 5 users were retweeted more than 5000 times, and @nenshi was the only individual in that group. Just @calgaryherald was retweeted more than 10,000 times.

I did not keep track of the most followed users this year, primarily because the information is readily available elsewhere. If you want to know who the most followed users in Calgary are, check out Twopcharts.

Clients

More than 4200 different applications and services were used to post tweets in 2012. For the first time since I have been tracking stats, the web is no longer the top dog! Here are the top ten:

  1. Twitter for iPhone
  2. web
  3. Twitter for BlackBerry®
  4. Twitter for Android
  5. TweetDeck
  6. HootSuite
  7. Instagram
  8. Facebook
  9. Tweet Button
  10. Echofon

The top ten clients accounted for 81.1% of all local tweets posted in 2012.

Coming Up

  1. Overview
  2. Users & Clients
  3. Hashtags & Links