Edmonton’s 311: six month status report

As you’ve probably heard by now, the City’s 311 service is not performing as well as expected. The Sun first reported the story last week, and the Journal followed up with an article yesterday. They key point mentioned in both is that wait times to connect to an operator are far longer than originally anticipated. As a result, an interactive voice response system is being considered for next year. I can’t imagine that will make callers any happier, even if it does make their calls slightly faster.

I personally think they should put more resources into 311 online. How many citizens even realize that they get online access to a lot of the information and services that 311 provides? The best way to reduce call times is to increase self-service options and quality so that citizens can bypass the phone altogether.

Fortunately, there are new self-service features being developed for release in October. The City will still need to communicate their existence effectively, however.

Background

The CRTC approved the use of the 311 phone number for municipal services back in November 2004, and Calgary became the first city to launch 311 on May 8, 2005. Here in Edmonton, City Council approved the service at its May 9, 2006 meeting. Edmonton became the first city in North America to use SAP’s CRM application to deliver 311.

The 311 service officially launched on December 16, 2008. Implementation was approved at a cost not to exceed $10 million (and it is on track to come in about $1.5 million under budget). Half of that amount came from an internal loan, which is to be repaid from operating savings (the other half came from a special dividend in 2005).

Six Months In

The report that went to the Executive Committee this week isn’t incredibly long at 7 pages, but it does have lots of information. Here are some graphics to help make it easier to understand the first six months of 311 operation in Edmonton.

Call lengths are one of the reasons everyone is complaining:

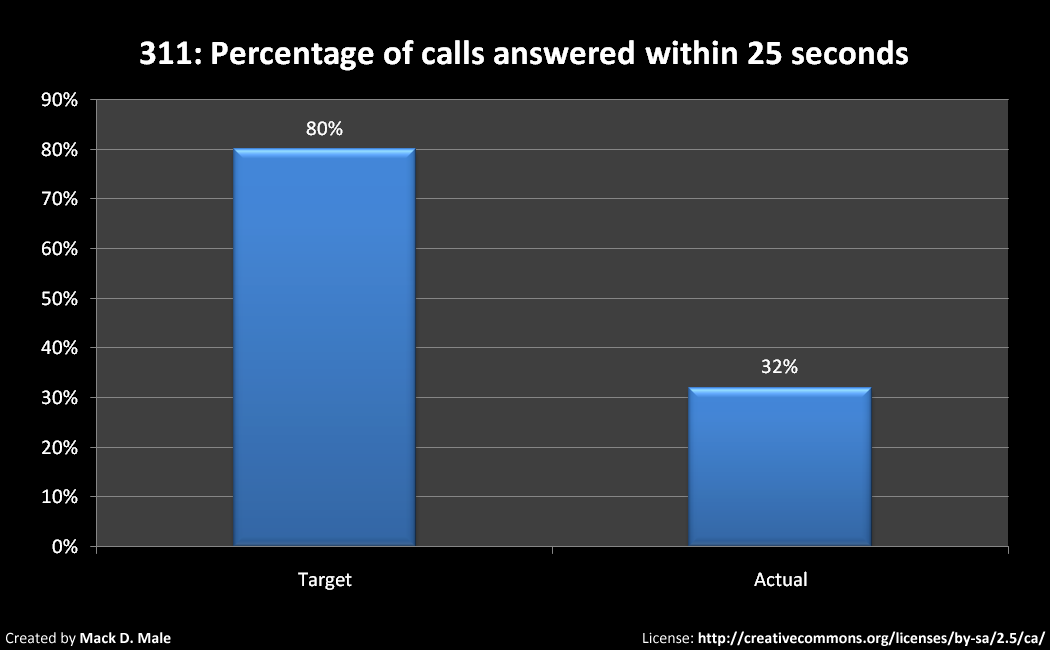
Wait times to get through to an operator are another concern:

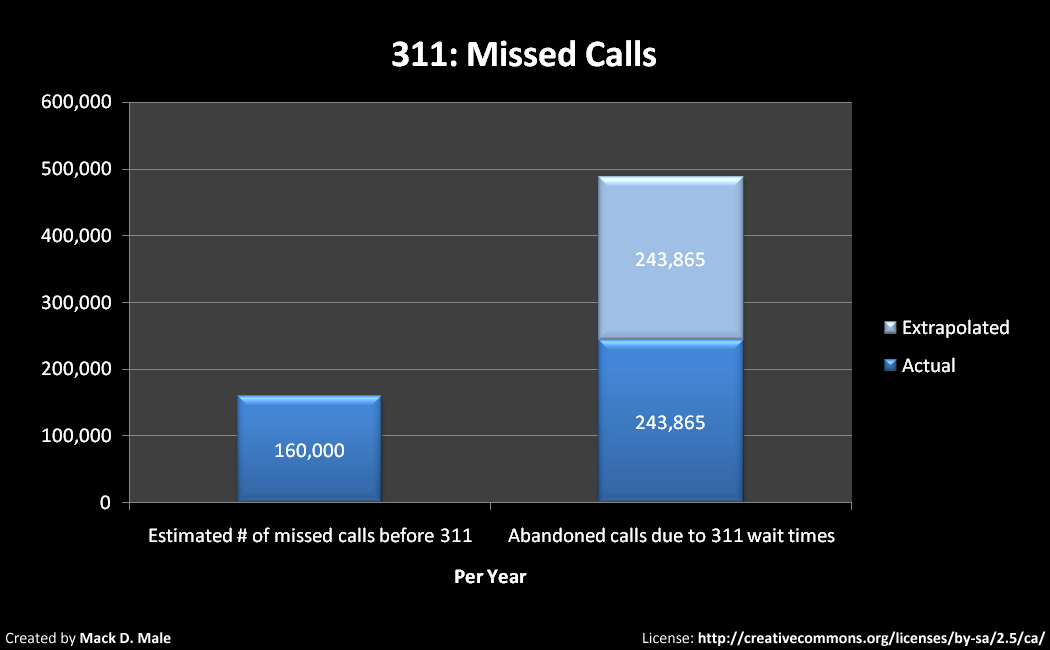
The 311 system was supposed to help the City capture the estimated 160,000 missed calls each year, but so far it is on track to make things much worse:

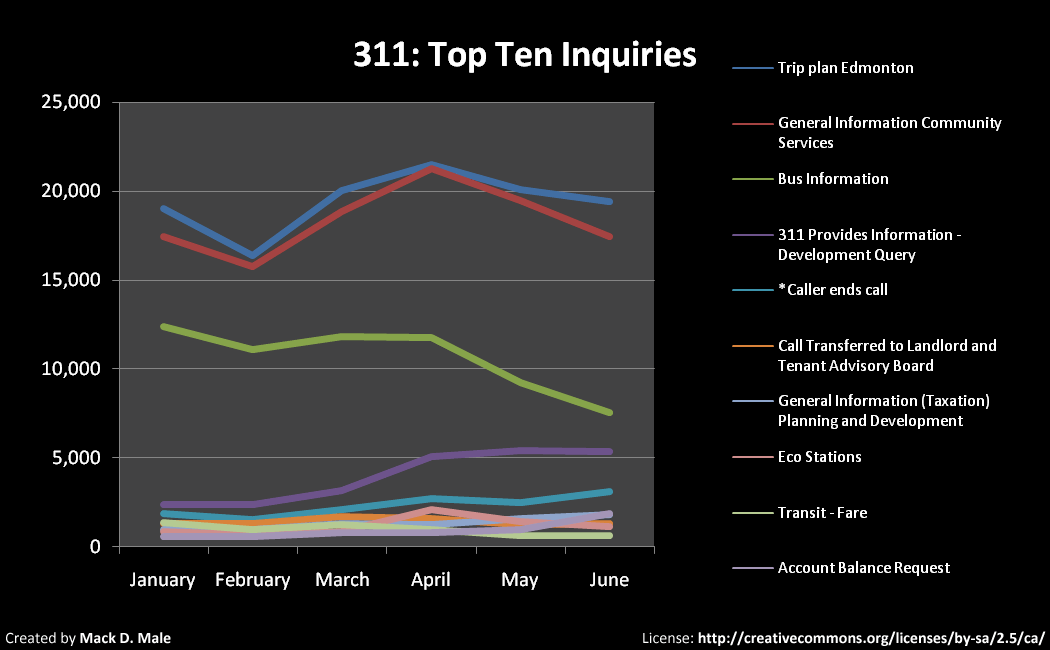
The report contains information about the top ten services:

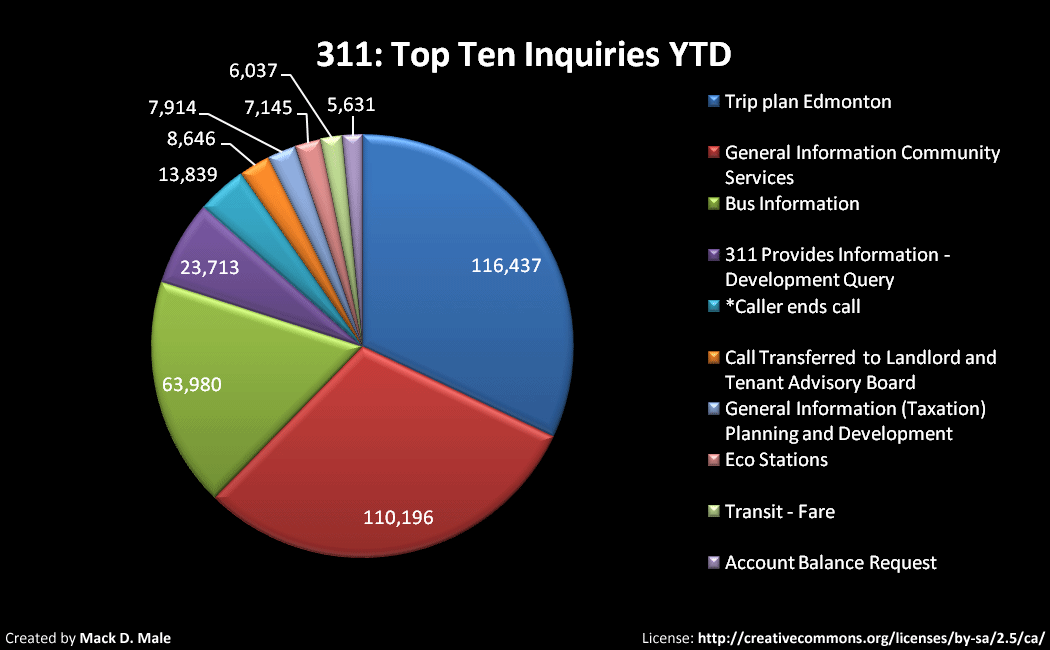
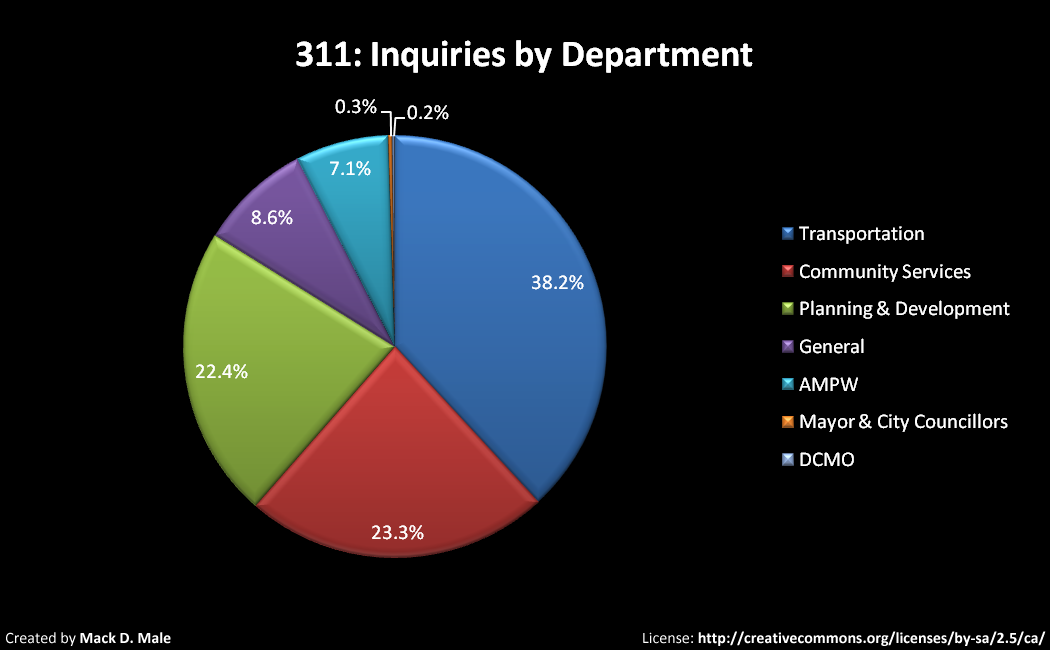
Transit inquiries make up a significant portion of all 311 calls, followed by Community Services inquiries. There’s a clear opportunity for transit to do more to reduce the number of calls going through 311. I find it odd that trip planning is such a common request actually, given that there’s a separate number for that (BusLink) not to mention the online trip planner and Google Maps.

Here’s the breakdown by department:

There are a few more graphs (without data values unfortunately) in the report, so take a look at those too. They show that the number of calls answered within 25 seconds is on the rise, and that the time it takes to get through to someone is declining.

Does this report suggest that 311 is “a disaster”? I don’t think so. All it shows is that there is work to do, and it sounds like the 311 team is on the case. Hopefully the departments they serve are as well.

Open Data in Edmonton? Follow Vancouver’s lead

Last week Vancouver launched an open data portal, providing one-stop-shopping for open data provided by the city. David Eaves called the launch “a major milestone for Vancouver” and explained:

The Data Portal represents an opportunity for citizens, especially citizen coders, to help create a City that Thinks Like the Web: a city that enables citizens to create and access collective knowledge and information to create new services, suggest new ideas, and identify critical bugs in the infrastructure and services, among other a million other possibilities.

He was also quick to point out that getting access to the data is just the beginning. Citizens have to use it, or risk losing it. The next day he launched VanTrash, an application to make garbage collection sexier. Use it or lose it indeed!

I think it’s interesting that he started with garbage collection, because I too identified that as an area that could use some innovation. A couple months ago, I spent about an hour on the phone with a manger in the Waste Management department at the City of Edmonton, trying to get access to the data behind the garbage collection schedules. Currently you can enter your address here to download your collection schedule in PDF. But if you want to find the schedule for a different part of the city, you’re out of luck. And even if you manually tried enough addresses to find all the zones and collection schedules, they’d be in PDF, which means you can’t easily add them to a calendar.

By the end of the call, I think he finally understood what I was after, and he said he’d have to get back to me. He never did, unfortunately. I can only hope that my request had an impact and that it will eventually help to open the data floodgates in Edmonton.

Open Data doesn’t have to be difficult!

Take a look at the data available at Vancouver’s data portal. Most of the data there is simple and exists elsewhere, in a less “creative friendly” format. A good example is the list of libraries. You can download the data in CSV, XLS, or KML formats, but it really just comes from the Vancouver Public Library website. The CSV contains the library name, it’s latitude, longitude, and address. Simple stuff, but potentially really useful if combined with other data sets.

Here’s an example in Edmonton. Let’s say I want to know how the crime rate of neighbourhoods with libraries compares to those without. What data would I need for that?

  • A list of libraries, with their locations (see below)
  • A list of neighbourhoods, with their boundaries
  • Crime statistics by neighbourhood
  • Census data for neighbourhoods to find comparable ones without libraries

Could you find this today? Yes, but it’s definitely not easy! The EPL website lists the libraries with addresses, so you’d need to figure out the lat/long on your own. The City of Edmonton website lists the neighbourhoods, but you’d need to figure out the boundaries on your own. The EPS website provides reported crimes by neighbourhood. And finally, the City of Edmonton provides census data for neighbourhoods in PDF.

If I could get all the above data in CSV format, it would have taken a matter of minutes to find the answer (I should point out that not all of that data exists at Vancouver’s portal either). Instead, I had to do a lot more work. The very rough result (because I compared with a random sample of similarly populated neighbourhoods) is that neighbourhoods with libraries were 1.5 times more likely to have crime than neighbourhoods without libraries in 2008. Though if you don’t count Downtown, then the crime rate is about the same for neighbourhoods with libraries and those without.

Maybe you’re thinking “what a useless example” and that’s fine – it is one of just hundreds or thousands of possible uses for that data! Just imagine what would be created if software developers and other creatives in Edmonton had access to the data.

Libraries Data

All this talk of open data, why not give you some? I’ve created a CSV of the Edmonton Public Library locations in the exact same format as the Vancouver Public Library data (minus eplGO in the Cameron Library). Enjoy!

Download the Edmonton Public Library location data in CSV

Onward in Edmonton

I’ve heard rumblings that the City of Edmonton will be doing some stuff in the open data space in the next couple of months, but I’m not holding my breath. There haven’t been enough conversations taking place. I’m hopeful that the right people are envious of the progress that has been made in Vancouver, however. I sure am!

EPS responds to my query about the Crime Mapping terms of use

Last week I posted about the new Crime Mapping site launched by the Edmonton Police Service (EPS). One of my criticisms of the site was the very restrictive terms of use or disclaimer that you must agree to before you can use the site. In particular:

While it is acceptable to pass the website link on to others in your community, you will not share the information found on the website with others other than with members of the Edmonton Police Service or other law enforcement agencies; and

You will only use this website and the information in it so you can inform yourself of, and participate in, this community policing initiative;

This is problematic because it effectively means that you can’t do anything with the data that EPS has now made available. You can look at it using their site, but you can’t then blog about that data, or add it to a PowerPoint presentation.

I emailed a request for clarification and received a response from Amit Sansanwal, Criminal Statistics Coordinator at EPS. I asked for and was granted permission (by their legal department) to publish his response:

The EPS views the Neighbourhood Crime Mapping website as a valuable addition to our community policing initiative.

The EPS, however, is of the view that this tool can only be effective and achieve its community policing objectives if people seeking the information visit the Neighbourhood Crime Mapping website directly themselves.

By visiting the website, hopeful participants in this EPS community policing initiative can learn about what kind of information is available to them (e.g. crime prevention and partnership programs) and how it fits within this program.

We appreciate your interest in this program and hope that you tell others about the existence of the Neighbourhood Crime Mapping website.

In a later email, Amit pointed out that the current preferred way to get EPS statistics is through Statistics Canada.

The crux of their position, if I understand it correctly, is that they don’t want people looking for crime statistics to come across an inaccurate or malicious source. That seems reasonable. The problem is that such a position assumes people are actively seeking the information. By opening up access to the data and allowing others to make use of it, they can potentially reach far more Edmontonians, not to mention the benefits that could come from mashups or other data visualizations. Furthermore, it seems as though they just want to force people to use the Crime Mapping site so that they can promote additional programs to users.

The Crime Mapping site is fun to look at, but I would argue its utility is restricted by the current terms of use. Unfortunately, it doesn’t look like that’ll be changing any time soon.

Data on Edmonton’s new 12-ward system

Last night City Council voted in favor of changing from the current 6-ward system to the more common 12-ward system used throughout North America. The change will take effect for next year’s municipal election. For more background, check out Dave’s post. You can also check out the City of Edmonton’s page for more information.

As an advocate of open data, I thought I’d share with you some data related to the new wards below. All of the data is available on the City website somewhere, but not in an easily consumable form. I’ve done the legwork to make it accessible.

Amendments made to the motion last night affected the wards a little:

  • Grovenor and McQueen neighbourhoods moved from Ward 1 to Ward 6.
  • CPR West moved to Ward 8 from Ward 10.
  • Calgary Trail North and Calgary Trail South moved from Ward 11 to Ward 10.
  • Some ravine boundaries were changed from “in-the-middle” to “top-of-bank”.

Here are the stats on the new wards:

In a table (download CSV file here):

Ward Population Electors
1 62,625 51,061
2 67,306 54,704
3 63,819 49,465
4 67,811 52,666
5 62,424 49,615
6 70,840 62,152
7 63,549 51,865
8 66,196 57,189
9 68,214 53,889
10 61,276 49,935
11 64,770 51,329
12 63,609 48,529

The average population of each ward is 65,203 and the average number of electors for each ward is 52,700. This data comes from the 2009 Municipal Census.

Here are the number of neighbourhoods in each ward:

I’ve also compiled a list of neighbourhoods in each ward which you can download in CSV here. Or if you’d rather just look, you can download the list in PDF here.

I’m trying to track down or create a good quality map of the 12 wards, but this’ll have to do for now. What I’d really love is lat/long coordinates for each ward. If you have something better than that graphic, let me know!

Go do something useful or interesting with this data, and then tell me about it. I’m looking to collect local examples to strengthen the case for open data at the City of Edmonton!

UPDATE: Here’s a better map in PDF format.

UPDATE2: Here’s an even better color map showing the wards and neighbourhoods in PDF format.

Calgary takes first steps toward becoming an Open City

A motion will go before Calgary’s City Council next week that outlines the first steps in the process of making Calgary an Open City. Calgary follows in the footsteps of Vancouver, which passed a similar motion back in May. DJ has all the details on the Calgary motion here. I think it’s pretty cool that the news is first announced on a blog!

Calgary’s motion will result in a report from City Administration to be presented to Council no later than December 2009, outlining the overall strategy for making Calgary an open city. In particular, the report will identify “opportunities to make more of The City’s data open and accessible while respecting privacy and security concerns , and ensuring that data is available through use of open standards, interfaces and formats.” Other aspects of the strategy will include increasing online citizen participation, procuring and supporting open source technologies, and increasing the number of City services available online.

This is exciting news for developers and other creative professionals in Calgary and elsewhere. I’ve been pushing for open data in Edmonton recently, and I really hope we’re not too far behind our southern neighbours on this issue. There are a number of advantages to making data available in open standards and formats:

  • Citizens can subscribe to data that is of interest to them
  • Data can be mashed together in new ways, revealing new information
  • Visualization of data can help citizens make better decisions
  • Citizens can work together to organize data
  • Government can learn more about its data from citizen contributions

Additionally, using well-understood, open formats such as XML or CSV helps to “future-proof” the data. You don’t need proprietary technology to read a CSV file – any programming language or software platform will work.

One issue that isn’t mentioned in Calgary’s motion but which is very important, is licensing. It’s important that when Calgary does make data available, that it does so in the least restrictive way possible. Either public domain, or creative commons, or something similar. It would be a shame if they made a ton of data available and then had ridiculous terms of use around it.

Open data is about empowering citizens to work with their governments. I’m encouraged by the recent interest among municipalities in Canada, and I hope the trend continues.

Edmonton Police Service (EPS) Crime Mapping tool now online

Back in June we learned that the Edmonton Police Service was planning to launch a new website that would enable citizens to find crime statistics for their neighbourhoods. This afternoon, the EPS Crime Mapping tool went online, and it does just that. You can search for stats on eight types of crimes in any neighbourhood across any time period since 2007. From the press release:

The new crime mapping tool will provide members and citizens with a better understanding of what is going on the neighbourhoods they work and live in.

I’ve been playing with the site today, and I like it. There are pros and cons, however.

How It Works

The first step is to agree to the disclaimer – more on that in a minute. Next, you pick the crimes you want statistics for. The eight types include assault, break and enter, homicide, robbery, sexual assaults, theft from vehicle, theft of vehicle, and theft over $5000. Third, you pick the neighbourhood – there are 357 listed in the system. Finally, you select the time period. There are some quick selections such as yesterday or the last 30 days, or you can enter any two dates. Click “Show Crimes” and your neighbourhood appears on the map, covered in colored dots to represent the reported crimes. Here’s what Oliver looks like for the last 30 days with all crime types selected:

There’s also a “View Statistics” tab above the map that will show you a table for the last three years broken down by month, with a graph below that.

The Good

There are some really good things about this site. First and foremost, the data is excellent. I’m glad that they included everything up-front, instead of doing a test release or something to start. Second, it’s built using Google Maps. This is a big win for EPS – it’s a stable technology that Google is continually making better, and I would guess that most Edmontonians are familiar with it. Third, it’s fast. Almost as soon as you click the button, your stats appear.

The Bad

There are two things about the site that I don’t like. First is the disclaimer – it’s too restrictive. These two points in particular are problematic:

While it is acceptable to pass the website link on to others in your community, you will not share the information found on the website with others other than with members of the Edmonton Police Service or other law enforcement agencies; and

You will only use this website and the information in it so you can inform yourself of, and participate in, this community policing initiative;

That effectively means you can’t do anything with the data. This is in direct contrast with what the press release would lead you to believe:

Providing our citizens with the real picture of neighbourhood crime is the first step in engaging them to do something about it. Members of the public will be better equipped with knowledge to work collaboratively with the EPS to reduce and prevent crime.

What’s the point of making the data available if you can’t do anything with it? Why can’t I blog about the crime stats in a particular neighbourhood? Or mash the crime stats up with some other data? I challenge the notion that simply being able to see the dots on a map equips me to do something about crime in my neighbourhood.

I’ve emailed the feedback address listed on the site asking about this, but I haven’t yet received a response.

The second bad thing about the site is that while it does make data available, it does so in an opaque and closed way. If Edmonton is going to become an open city (with respect to data), sites like the crime mapping tool need to provide information for multiple audiences. One is the average citizen who is happy to click around on the map. Another increasingly important audience is the creative professional who wants to do something with the data, and needs it in a machine-readable format such as a CSV or XML file.

The Undocumented API

The first thing I did after testing the site with my neighbourhood was poke around for clues about where the data comes from. It didn’t take long to realize that there’s a JSON web service behind the application. You can access it here. It’s probably not meant for public consumption, but it’s there and it works. I was able to throw some code together in about 30 minutes to get data out of the service. While it would still be good to have static data files available, the API largely negates the con I mentioned above. As it is unofficial however, who knows if it will remain active and working, so enjoy it while you can.

Final Thoughts

Overall I think the Crime Mapping tool is excellent. We need more applications and services like this, though with less restrictive terms/licensing and easier-to-access data. Kudos to EPS for building this, and let’s hope they improve it.

UPDATE: There are more details in this article. For instance, the tool apparently cost $20,000 to build, and is automatically updated each morning.

Social Media and the City Centre Airport Debate

Where there’s smoke, there’s fire.

On Thursday morning Jeff Samsonow and I chatted about the City Centre Airport for a few minutes on CBC Radio. During the interview I was asked if I thought social media played a role in the debate. I answered, “absolutely”.

Also on Thursday, Graham Hicks mentioned the “rise of youth” in his column, observing that “the younger demographic flexed its muscle” and that “the "social media" was solidly anti-airport”. He specifically mentioned myself, Jordan Schroder, Dave Cournoyer, and Michael Janz.

Scott McKeen got things rolling on Friday with his column in the Edmonton Journal, stating that “a new reality emerged along with a new establishment.” He too mentioned age:

Blogger Mack Male used Twitter to go live from council chambers during the final debate. In one Twitter post, he wrote: "There is a silver-haired guy in the audience shaking his head during Don Iveson’s remarks."

Global Edmonton’s Linda Nguyen interviewed me Friday for a piece that aired during the evening news (click on “silent majority” because their video system sucks). Councillors Iveson and Krushell were also interviewed for the story, and cited the use of social media by young people as a trend to keep an eye on.

On Saturday, Todd Babiak’s column in the Edmonton Journal took the story to another level. He interviewed both myself and Jordan Schroder, and said:

It must have been devastating for the city’s most powerful men and women to watch a group of virtually connected–but politically unconnected–young people creating and controlling public debate with speed, elegance and respect.

Is it just coincidence that so many stories on the same topic appeared over the last few days? Were they all just trying to avoid another negative comment from Cal Nihols and his side? Maybe, but I think there’s more to it than that.

Social Media Lessons

Social media definitely played a large role in the City Centre Airport debate, on both sides. As I mentioned in my post introducing NotMyAirport.ca, AEG made use of social media for its campaign too, though the local media seems to have glossed over this fact. David MacLean was active on Twitter, and actually was the first to use the #ecca hashtag that has become so popular. You may know that I didn’t create the Not My Airport group on Facebook, Jordan Schroder did. I just looked for the largest pro-closure group and linked to it – Jordan then renamed it and made me an admin. David told me a similar thing happened with their side’s Facebook group. David and I both took part in the web debate hosted by FusedLogic, and we both encouraged others to email their councillors.

All of which begs the question, if both sides had such similar stories, why were the pro-closure side’s social media efforts so much more effective? The fact that, at least in my opinion, we had a stronger case notwithstanding, I believe the following reasons are key:

  1. Blogging

    Blogs are still the stars of social media. The pro-closure side made use of blogs quite extensively. Myself, Dave, Michael, Adam, Adam, and Jeff all blogged about the issue numerous times, and I’m sure there were others too. A blog has many benefits, but three in particular played a role here: a place to expand on thoughts and to lay out facts, a good ranking in search engines, a place for others to leave comments and have a conversation. The pro-Muni side didn’t have any blogs, and they missed out accordingly.

  2. Consistency

    Perhaps the most important thing you can do when you have a blog is to post regularly. I did that, as did others. We were also consistent with other tools. We kept the Twitter stream updated, and we regularly sent messages to our Facebook group and posted on the wall. The debate seemed more alive because we were consistent with our communications.

  3. Using the right tool for the job

    Blogs are great for sharing a relatively large amount of information. Twitter is great for short, real-time bits of info. Here’s an example: I listened to the live stream for the public hearings, and Twittered about it in real-time. The pro-Muni side was nowhere to be found. Similarly, I live tweeted the final decision, because that’s what Twitter is good at. The pro-Muni side again was silent. Even the web debate is a good example – I suggested it because I knew it would give us time to explore the issues and a chance for others to converse online.

  4. No distractions

    You might call it grassroots or simply having no money, but the pro-closure social media efforts were not affected by other “distractions”. The billboards, lawn signs, etc. all have an impact – in this case, they made the pro-Muni side seem like it had some money, and that took away from the authenticity of their social media efforts.

Over the weekend, Adam and Dave wrote about Babiak’s story. Both suggested that there’s more to the story than just young people using social media. I agree with them. If age played any role, it’s that young people are more comfortable with social media tools and thus used them more effectively. That’s a bit of a generalization, however. There were young and old people on both sides of the debate.

Final Thoughts

There’s no doubt in my mind that the City Centre Airport debate and the role social media played in that debate will have a lasting impact on politics in Edmonton. Having said that, it’s important to realize that change doesn’t often happen overnight. Just as it will take years for the airport itself to give way to something new, political decisions will continue to be made the way they always have been, at least for the foreseeable future.

The difference now, I hope, is that social media has been legitimized in the eyes of our local political system and should see greater use in the future.

I think that’s something to be proud of.

Edmonton City Centre Airport Decision: Phased Closure

City Council voted today to implement a phased closure of the City Centre Airport. The motion put forward by Councillor Gibbons described two phases and passed by a vote of 10-3. I’m happy with the decision that was made today, and I commend Council for taking a courageous step toward ensuring the City’s Vision and Strategic Plan are realized.

Here is the vote breakdown for adopting the motion (which you can download here):

Councillor Karen Leibovici (Ward 1) Yes
Councillor Linda Sloan (Ward 1) No
Councillor Ron Hayter (Ward 2) No
Councillor Kim Krushell (Ward 2) Yes
Councillor Ed Gibbons (Ward 3) Yes
Councillor Tony Caterina (Ward 3) No
Councillor Jane Batty (Ward 4) Yes
Councillor Ben Henderson (Ward 4) Yes
Councillor Bryan Anderson (Ward 5) Yes
Councillor Don Iveson (Ward 5) Yes
Councillor Amarjeet Sohi (Ward 6) Yes
Councillor Dave Thiele (Ward 6) Yes
Mayor Stephen Mandel Yes

Council started discussing the issue at 1:30pm, and didn’t wrap up until nearly 6pm. There were at least four rounds of questioning, driven largely by Councillors Caterina and Sloan who were vehemently opposed to the motion. After the questioning finally ended, Councillor Caterina put forward a motion to refer the issue to Administration which was soundly defeated.

Three amendments were made to the original motion. Councillor Iveson’s two amendments were “friendly”. Councillor Krushell’s amendment stated that after scheduled service licenses expire at ECCA in June of 2012, that they not be renewed. All three amendments were approved, and as soon as the final motion is online I’ll link to it which you can download here (PDF).

It became clear as Councillors gave their final remarks that the motion was going to pass. I thought Councillors Henderson, Iveson, and Krushell made excellent comments about why this decision needed to be made, speaking in particular about the future. Councillor Leibovici mentioned the role of social networking in this debate (more on that in a future post). Mayor Mandel used his time to make it clear that “this is a closure motion.” Councillor Gibbons used his time to get a dig in at Councillor Caterina, saying “if you can’t win, don’t bring it forward.”

After the vote passed, a motion from Councillor Sloan was brought forward that called into question the legality of Councillor Gibbons’ motion (the City’s legal counsel gave the OK hours earlier). It also requested that quarterly updates be provided to Council on legal issues related to the City Centre Airport. The motion was split – the first part was defeated, the second part (quarterly updates) passed.

What happens next?

The following will happen immediately:

  • Runway 16-34 will be closed. General aviation business activities will be adjusted to accommodate a one-runway airport. Medivac service will be maintained.
  • As a result, a GPS landing system will likely be added to runway 12-30.
  • The parcel of lands adjacent to runway 16-34 that can be surrendered to the City once the runway is closed will be identified.
  • Negotiations will begin with NAIT and the Province of Alberta to allow for NAIT expansion.
  • The City of Edmonton will create a development office and will work to set out long-term visioning plans for the ECCA lands in their entirety. The plan will be presented to Council by November 2009.
  • Plans for realignment of the NAIT LRT line based on the closure of 16-34 will be provided to Council no later than September 2009.
  • The downtown plan will be adjusted to take into consideration the immediate removal of the overlay height restrictions.
  • The City of Edmonton will develop a communications strategy to inform the public about the impact of this decision.
  • The City Manager will negotiate with Edmonton Regional Airport Authority (ERAA) to make mutually acceptable lease amendments.

The following will happen sometime in the future:

  • ERAA will work with Alberta Health Services on a long-term system design to facilitate Medivac operations at the Edmonton International Airport or other regional airports.
  • The final closure date will be determined by City Council with input from ERAA when the lands are required to support the long-term land development plan.
  • After the final closure date is set, environmental remediation will take place.

What does this mean?

Council decided today to close the City Centre Airport. They stopped short of attaching dates however, which makes the motion much weaker than it could have been (during my live-tweeting I called it “gutless”). Both Mayor Mandel and Councillor Henderson addressed this in their final remarks, stating that Council’s intentions should not be misinterpreted – the intention is to close the airport.

I fear the lack of a timeline will open the door for this to be discussed again in the future, however. At what point are the lands “required to support the long-term land development plan”? Who decides that and brings it forward, especially if the City is to be the developer of those lands? I do believe that the direction is clear, that the airport is to be closed, but the lack of a final closure date makes me uncomfortable.

It’s important to realize that we’re a long way from seeing the airport completely closed. New communities are not developed overnight, and especially not world-class, transit-oriented ones. The City needs to take the time to come up with a solid, exciting plan that Edmontonians readily support.

Final Thoughts

I think Council made a bold statement today. By voting to close the City Centre Airport, Council made it clear that they’re willing to do what it takes to ensure Edmonton’s future is bright. I think today’s decision was an important step in the push to create a more vibrant, sustainable, innovative, and livable Edmonton.

The City Centre Airport will be closed, and that’s good for Edmonton.

UPDATE (7/9/2009): You can download the final version of the motion here (PDF).

Council’s Q & A on the City Centre Airport

I know I’ve been writing a lot about ECCA lately, but with the Council meeting taking place tomorrow afternoon, it’s crunch time. I think the most likely outcome is that Council will vote for a staged closure of the airport (shutting one runway down initially, with the rest to follow at a later date). The only other outcome that I think has a chance is that Council will somehow delay the process, likely by asking for additional information.

During the public hearings last week, Council asked a number of questions (75 to be exact). This afternoon, the answers were published online (you can download the Word doc here). It’s worth reading the entire thing (50 pages, which includes the ECCA 2007 Annual Report) but I thought I’d highlight a few here.

On height restrictions:

Examples of major past projects that were reduced in height or could have developed higher were it not for the Airport Protection Overlay (APO) height limitations include the EPCOR Tower (101 Street/105 Avenue), the AMA Building (109 Street/118 Avenue, the Royal Alexandra Hospital Expansion, two residential towers in Railtown, and Aurora Developments (105 Avenue/101 Street).

On medivac (there’s not as much in the answers as you might think):

Many stakeholders noted that the medevac system needs improvement, whether or not there are changes to ECCA. They also noted with all ambulances (ground, fixed wing and rotary wing) potentially being managed by Alberta Health Services, an opportunity exists for improvement of patient care.

On a third party managing the airport:

The Board of Directors of Edmonton Airports approved a resolution on June 20, 2009 that “For as long as the Edmonton City Centre Airport lands are used as an airport, Edmonton Airport is committed to manage the Edmonton City Centre Airport as an airport in accordance with the lease to the expiry of the lease term.” Therefore, the option of having the ECCA separately managed is not available for consideration.

On competition for development throughout the City:

Armin Preiksitis & Associates estimates that the current major development sites underway or expected in the City will contribute almost 35,000 multi-family units. If no other developments come on-line, those units will be completely absorbed in 2019, and there will be 2,453 multi family units needed each year thereafter. That is the equivalent of over 8 30-story condo towers and 650 townhouses per year. As part of the City’s multi family dwelling supply, the ECCA lands would reduce the rate of absorption at competing properties and lengthening the development timing.

On the timeline for closure:

It needs to be recognized that potential redevelopment of the ECCA lands is a mid-term to long-term proposition. If you refer to the report (Report 2009DCM032, Attachment 2, pages 10 of 299 and) it is assumed that the earliest redevelopment on the ECCA lands would begin in 2016 – seven years from now. Colliers International, based upon market conditions and competing developments, estimates a 23-28 year build out period.

On the creation of economic activity:

To say that Airports Create Jobs, leaves you with the wrong impression, that if you develop an airport, you will create economic activity. This is only true to the extent that the demand for these services already exists. If you took the statement that aviation creates jobs at face value, you would consider building another airport in Edmonton as a measure for generating economic growth. This of course is not something anyone would actively promote.

On how much the City will have to pay to maintain ECCA:

Like most general aviation airports, the City Centre Airport cannot fully pay for its capital costs. Those costs are subsidized by the users of EIA. Also, the ten year capital requirements of the airport approximate $35M and one of the more significant items is storm water improvements. It is expected that the city’s contribution towards the completion of that component is up to $10M.

One of my favorite sections rips apart the Ascend report put forward by AEG (question 31). Definitely worth a look.

I’ll be tweeting live from the City Council meeting tomorrow afternoon (July 8th) at 1pm. You can follow along with the #ecca hashtag. I hope they make the right decision.

Transforming the City of Edmonton IT Branch

On Friday the City of Edmonton’s IT branch held its first ever IT Vendor Open House. The event was a big success, with dozens of local technology professionals stopping by throughout the day. Attendees had the opportunity to learn more about how the IT branch does business, and about some of the initiatives and projects that are coming down the pipe. The event also gave the IT branch a chance to share some of the work they’ve done recently to transform internally.

Chris Moore, the City’s Chief Information Officer, delivered two keynotes during the day, called “IT New Directions”. Chris isn’t your typical CIO – he doesn’t have a desk in his office, he avoids PowerPoint whenever possible, and he is always one step ahead of everyone else. For example, it wasn’t possible for anyone to run Macintosh computers at the City until recently. While everyone has been focusing on making that a reality (a few Councillors switched over earlier this year), Chris is looking at what’s next: bring your own technology. Chris imagines an environment in which employees can run whatever they like.

Edmonton CIO Chris Moore

He touched on a few main points:

  • There are around 1100 different applications and systems at the City. Only 132 of them are Access or Excel. That means there’s an incredible amount of overhead required for management and support, not to mention data in 1100 different places.
  • Throughout the spring, the IT branch held mini town halls, with about ten employees in each (there are 300 employees total).
  • Out of those discussions and other meetings, a new Agile Service Delivery Model emerged.

One of the few slides Chris showed during his keynote was a list of highlights from the past sixty years:

  • 1954: Univac 120 – First in Western Canada
  • 1960: IBM 1401 – First in Canada
  • 1966: IBM 360 – One of the first in Canada
  • 1978: Early adopter of GIS
  • 1980: City recruits IT staff from the U.K.
  • 1985: Sale of COINS to Orange County, CA
  • 1991: gov.edmonton.ab.ca, “early Internet adopter”
  • 1996: POSSE – Award winning system
  • 1999: One of the first cities to move to Enterprise GIS
  • 2009: First city in North America to use SAP CRM for 311

The slide was titled “Western Canada’s Municipal Information Technology Leader”. That’s perhaps a bit of a stretch for the last few years, but it’s certainly the goal for the future. Chris and his team want to get back to being the innovators.

On June 18th, the Information Technology Corporate Audit Report for 2008 was released and it talks a lot about the drivers behind the transformation that Chris touched on in his keynote. Here’s a Wordle of the report:

Among other things, there were two clear conclusions from the report (which you can download here in Word format):

  • That Corporate IT resources can be used in a more cost effective and efficient manner.
  • That the IT Governance Framework is not effective in prioritizing and allocating operating and capital resources for information technology.

In reality, there isn’t much of a Governance Framework at the moment, but the IT branch is already working to change that. They’ve created something they call COKESFORIT, or the “ten ways of being”:

  1. Collaborative
  2. Open
  3. Knowledgeable
  4. Empowered
  5. Supportive
  6. Flexible
  7. Organized
  8. Responsible
  9. Innovative
  10. Trusting

The idea is that everything the IT branch does should align with these concepts.

During ICLEI a couple weeks ago, visual facilitator Roy Blumenthal worked with the IT branch, and captured eighteen impressive visual notes. As a fan of open data, I like this one:

I’m excited about the changes taking place at the IT branch. I think the organization is heading down the right path: to become more efficient and more transparent. If you’ve got ideas or feedback, now seems like the right time to get in touch with them!