Open Data in Edmonton is exciting again

After a few years of stagnation, I feel like open data in Edmonton is exciting again. This has been a great year for open data and open government in our city! Here’s an update on what’s been happening.

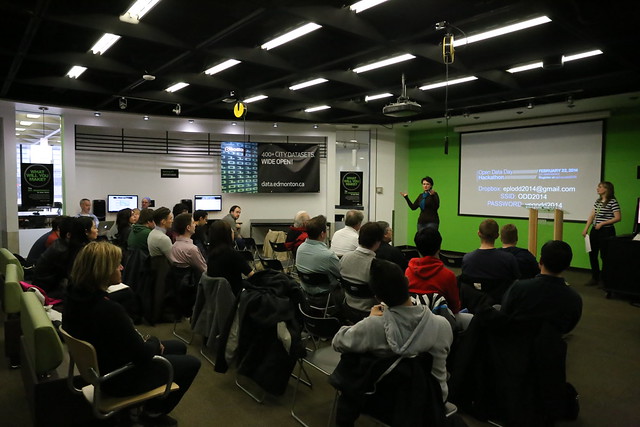
International Open Data Day really kicked things off back in February with a hackathon hosted by EPL at the new Makerspace. It was a great opportunity for developers to come together to take a fresh look at the municipal, provincial, and federal data catalogues, all of which have grown considerably in the last year or so.

International Open Data Day Hackathon

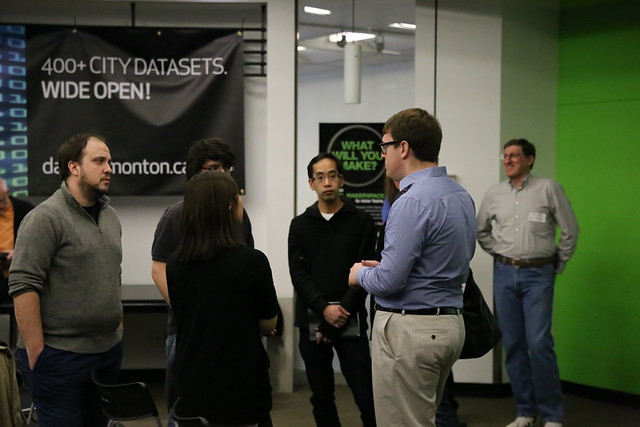
In May, a group of interested citizens organized a hackathon called HackYEG. Mayor Iveson spoke at the event which was a great success and led to a number of really interesting projects. The event also led to a new citizen meetup, called Open Edmonton. The group was started by Lydia Zvyagintseva and David Rauch and meets at Startup Edmonton on the third Wednesday of every month. Follow them on Twitter for the latest events and other “open” news.

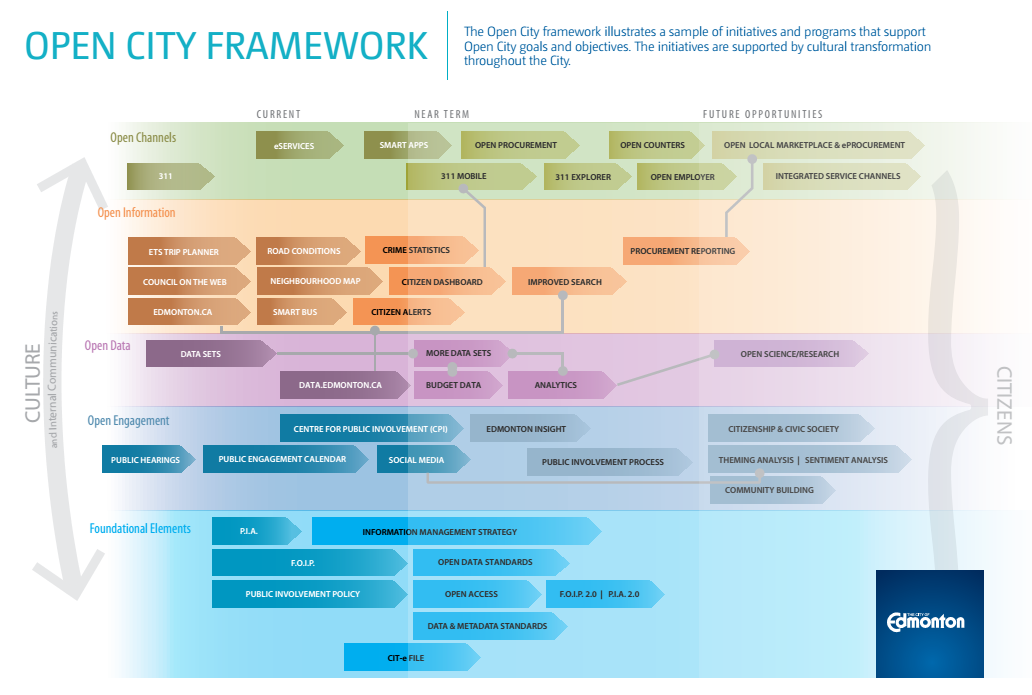
The City of Edmonton unveiled its Open City Initiative in June, which highlighted a number of principles, goals, and objectives that will help to make Edmonton an Open City. It’s heavy on talk and light on action, but it signals a renewed effort on the part of the City to support open data and related initiatives. Importantly, it also opened the door to a policy on open data and open government, which would change the dynamic inside the City from “we could support this” to “we must support this.”

open city framework

The federal government began a series of consultations in February this year to gather input on Canada’s Action Plan on Open Government 2.0. Edmonton was included in those consultations, with a roundtable event that took place on August 27. Treasury Board President Tony Clement hosted the session that was attended by representatives from the City of Edmonton, Province of Alberta, industry, and the community at large.

Treasury Board President Tony Clement

MP Clement was also in Edmonton talking about open data last year, gathering input for the 1.0 verson of the plan. The draft 2.0 plan will be available for review and comment starting October 6.

At the end of August, I think open data scored a small but important victory when the results of the 2014 Municipal Census were made available. For the first time, the data was in the open data catalogue at the same time as it was released to the public in PDF and via the media. A sign that the Open City Initiative is being taken seriously, perhaps?

Earlier this month Edmonton hosted a stop on the cross-Canada motorcycle tour on open government undertaken by Richard Pietro. The whole idea behind the tour was to “ignite conversation about open government and open data” and to “encourage citizens to become more civically engaged.” A number of local advocates spoke at the event, which highlighted some of the success Edmonton has had with regards to open data. Here’s a recap from Richard himself.

Open Government Tour
Photo by Richard Pietro

Last week I was one of five speakers at the Lunchalytics event focused on open data. Chris Moore, Eugene Chen, Mark Diner, and Michael Parkatti also spoke about open data and analytics. The room was packed and some really great projects and initiatives were highlighted, such as the Alberta Economic Dashboard. There’s clearly a growing interest in such visualizations and tools.

Later this week I’m speaking at the Right to Know Forum, hosted by Alberta’s Information and Privacy Commissioner Jill Clayton. The event will feature presentations on right to access, information management, open data initiatives, and the benefits of open data. It’s a sign of just how far open data has come that OIPC is hosting a forum on the topic!

Throughout the year, the various data catalogues have been growing. And it’s not just Canada, Alberta, and Edmonton that are making datasets available. Other communities in the Edmonton Region are getting behind open data too, like the County of Strathcona which now has more than 100 datasets available to citizens. Even St. Albert has started experimenting with open data, through its Property Search tool (which allows you to export the data).

I know that some Edmontonians, like Matthew Dance, Chris Moore, and Mark Diner, have always been local open data advocates, even and especially during the years I’m calling stagnant. But lately it’s refreshing to see an entirely new group of Edmontonians getting involved. Just this evening I was at a meeting in which the City’s open data catalogue was referenced (and not by me!). There’s a growing awareness and interest that is encouraging.

If you’ve been on the fence about open data or have been thinking about learning more, now’s the time. Check out Open Edmonton and get involved!

International Open Data Day in Edmonton

Today is Open Data Day around the world, and here in Edmonton we celebrated with a hackathon at the Edmonton Public Library’s new Makerspace. A few dozen people came out to learn more about open data, to hear ideas from others, and to start exploring and building.

International Open Data Day Hackathon

The day started off with “speed data-ing”, where anyone who wanted to could pitch an idea to the room. Once the pitches were done, there were a lot of great conversations taking place as everyone figured out how they wanted to spend their time for the rest of the day. Teams slowly self-assembled, and then everyone got to work.

International Open Data Day Hackathon

At the end of the day, teams had the opportunity to show off the progress they had made throughout the day. One team worked on visualizing open datasets so that they could be more easily accessed and used by educators. Another team looked at visualizing how many dogs there are and which breeds are most popular in different areas of the city. The winning idea was a visualization of tree data in Edmonton. Hackathons are typically longer than just a few hours, so it was impressive to see what everyone was able to come up with given the time constraints!

International Open Data Day Hackathon

There has never been a better time to be an open data developer in Edmonton. The City of Edmonton’s open data catalogue now contains more than 400 datasets, and the Citizen Dashboard that sits atop the catalogue recently won a national public-sector leadership award. The Government of Alberta’s open data catalogue also has more than 400 datasets now, and it only launched last May. The Government of Canada recently expanded and updated its large open data catalogue. And just this week, Strathcona County launched its own data catalogue featuring more than 60 datasets.

International Open Data Day Hackathon

Many other cities around the world hosted hackathons today too. Here’s what Open Data Day is about:

Open Data Day is a gathering of citizens in cities around the world to write applications, liberate data, create visualizations and publish analyses using open public data to show support for and encourage the adoption open data policies by the world’s local, regional and national governments.

Open Data has come a long way over the last few years. It has been adopted by governments around the world both large and small, and even organizations like the G8 have adopted an Open Data Charter. Countless apps and services have been developed to take advantage of all that information, and I think the best is yet to come. If you’re looking for an open data primer, check out the Government of Canada’s Open Data 101 or check out the Apps Gallery.

Thanks to the City and EPL for hosting a fun and creative day at the Makerspace! You can see more photos from the day here.

Talking open data in Edmonton with Minister Tony Clement

Tony Clement, President of the Treasury Board of Canada, was in Edmonton today as part of a cross-country tour to gather feedback from the Open Data community. The federal government is preparing to launch a revamped Open Data Portal, and Minister Clement has been given the mandate to make it happen. After stops in the morning at Startup Edmonton and TEC Edmonton, Minister Clement was at City Hall for an Open Data Roundtable, hosted by the one and only David Eaves.

"Open Data is a global movement that is really gaining momentum across the country. Our Government wants to ensure we are making it as accessible as possible so that innovators and enthusiasts can harness this rich resource," said Minister Clement. "We are getting ready to unveil the next generation Open Data Portal and the input we received from Edmonton’s vibrant Open Data community will help us build a user-friendly site that will allow users to capitalize on this opportunity."

In addition to holding face-to-face meetings, Minister Clement also hosted a Google Hangout on Open Data last month. You can watch the whole thing here:

I was fortunate enough to be invited to the roundtable today, along with roughly two-dozen other Edmontonians interested in open data. We had a very limited amount of time to chat, but I think we still discussed a wide range of topics. I hope the information gathered was indeed valuable for the team in charge of the new portal.

As host, David organized our time around a series of questions. The first was to suggest ideas for what the next generation open data portal should be. We broke into small groups and then shared ideas back with the larger group.

The first thing I suggested was that it should not look like it was designed in 1995. I find all of the Government of Canada websites lacking in the aesthetics department! Certainly there’s something to be said for consistency, and I understand there’s an initiative underway to reimagine the entire GoC web presence. On the flip side of consistency though are the preconceptions that you may not want to be carried forward. If I look at the Open Data Portal today, it looks like every other government site, which makes me think it’ll be a mess of weird hierarchies and PDFs buried away. It’s not very welcoming or inviting!

Another theme was based around the idea that we can’t build a data portal that serves all possible audiences. But, we can do more than we are currently. So my group discussed the idea of intent-based profiles. The idea is you’d login, set some criteria like whether you’re a developer or not, and maybe your location, and the portal would then give you a personalized view. Of course, anonymous access should be preserved, so it shouldn’t be a requirement that you need to login.

Three other themes that emerged included: historical data and the realization that any data we create now will at some point become historical, articulated well by Heather and Maureen; the notion that the portal should facilitate the two-way movement of data, so that citizens can publish data into the catalogue as well as get data out of it; and the fact that documentation about data is important, and it doesn’t necessarily have to be created top-down.

The second question was related to datasets, both specific datasets that we’d like, but also criteria that make datasets valuable and/or interesting. The first thing that came to mind for me was geography. I’d love to be able to see all of the datasets related to Edmonton, or to municipalities, or to Alberta, or to provinces. Right now you have to really hunt to find datasets that compare cities, for instance.

I think Matt‘s two suggestions in response this question were spot on. The first was that the data he finds interesting is the data that makes the government uncomfortable. Minister Clement jumped in to assure us that there’s no conspiracy preventing certain datasets from being released. That would suggest a level of organization that most governments just don’t have, he joked. The second suggestion was that geographical data should be a key foundational dataset. Let’s see a base map of the country, zoomable to the neighbourhood level. Or to whatever smaller regions exist, whether it’s postal code, census district, garbage collection zone, or something else. I love this idea, and my only add-on suggestion was that geographical data doesn’t necessarily have to mean maps. Knowing the list of neighbourhoods or postal codes can be incredibly valuable outside of a map as well.

A few other themes that emerged about datasets were trends and historical data (I personally love the idea of a revision history for any datasets), some sort of metadata (the first dataset any portal should have is the list of datasets it contains, David suggested), and the notion of a data management plan.

We finished up the roundtable with a brief discussion on data standards, followed by a few minutes of open time. I spoke up on data standards along with Ben and Eugene, and suggested that data standards fall squarely under the "nice to have" category. It would be great if different datasets shared a common format, but we’d rather just have the data and worry about the differences with an abstraction layer.

Final thoughts mentioned by the group included dogfooding (the government should actively use its own data portal and datasets), the idea that everyone carries a phone and could be contributing data back into the catalogue, and the future world described by Devin that I think can be summarized as the Internet of Things. "The idea that we searched a catalogue of datasets will seem just as quaint as when we searched the web using Lycos," he said.

I really enjoyed the roundtable today, and I appreciate Minister Clement and David Eaves taking the time to listen to what we had to say. Thanks also to Chris and Ashley from the City for providing the venue and helping to facilitate.

Reflecting on it now, I think what I enjoyed most about the roundtable was the opportunity to chat with people in the local open data community. I haven’t given open data as much public attention lately as I should, and when you shift your gaze elsewhere it’s easy to miss all of the incredible people doing great things.

Edmonton’s new official population is 817,498

This morning the results of the 2012 Municipal Census were released, and Edmonton’s new official population is 817,498. That represents annual average growth of about 12,000 since 2009 when the last census was conducted.

Mayor Mandel seized on the numbers related to age – the largest proportion of residents are in the 25-34 demographic (about 14.5%):

“The growth in population indicates that Edmonton is a city of opportunity,” said Mayor Stephen Mandel. “It is gratifying and exciting to know that so many young people are calling Edmonton their home. This reinforces the appeal of Edmonton, and the value of what our City has to offer; opportunity, culture and quality of life.”

Here’s what our growth curve looks like:

Here’s a look at the population by age group:

One of the new questions asked this year was about mode of transportation from home to work. The results are not incredibly surprising – roughly 80% of Edmontonians get to work by automobile:

You can see all of the results here, including PDFs for each ward and neighbourhood. Unfortunately I can’t do a detailed comparison by neighbourhood, because the open data catalogue has not been updated and I’m not going to sift through 375 PDFs to get the data I need. A note on the website reads: “2012 results will be added to the Open Data Catalogue in early August.” While I suppose it’s a positive that the data will in fact be uploaded to the catalogue, there’s absolutely no excuse for it not already be in there. I feel like I’m fighting the same fight, three years later.

I was most interested in Downtown however, so I did look at the PDF. The population increased far less than I had anticipated, rising to 12,199 from 11,572 (growth of about 5.4%). In other words, just 1.8% of the city-wide population growth occurred in the Downtown neighbourhood. Clearly we still have work to do (perhaps surrounding neighbourhoods grew more, will wait for the open data to analyze that).

Last year City Council passed a new Municipal Census Policy which states that a census will be conducted every two years starting in 2012. Throughout the month of April, census workers knocked on doors asking Edmontonians a variety of demographic questions. The results are important because many grants from other orders of government are calculated on a per capita basis. Additionally, the City needs updated numbers to effectively plan services, and to ensure ward boundaries result in fair representation by population.

The next Municipal Census will be held in April 2014.

City Council data now available in Edmonton’s open data catalogue

Yesterday Edmonton became the first city in Canada to release “a fully robust set” of City Council datasets to its open data catalogue. A total of five datasets were released, including meeting details, agenda items, motions, attendance, and voting records. There are now more than 100 datasets available in the catalogue, with more on the way.

Here’s the video recording of the news conference:

The City also produced a video about the new datasets:

The Office of the City Clerk is responsible for managing Council & Committee meetings, boards, elections, and more. The release of this data (referred to as “Clerk’s data” by some City employees) is another example of the way that office has embraced technology over the years. Kudos to Alayne Sinclair and her team, as well as Chris Moore, Ashley Casovan, and the rest of the IT team for making this data available!

I’m really excited about the potential for this data. The information has long been available on the City’s website, it was just locked away in meeting minutes as “unstructured” data – possible for humans to read relatively easily, but not for software. Now that it is available as “structured” data in the open data catalogue, applications can be written that take advantage of the data. You can find the data under the City Administration tab of the catalogue. Unfortunately the datasets only go back to June 1, 2011 instead of the start of Council’s term in October 2010. Currently, the datasets are updated daily.

I’ve now had a chance to look through the data, and while it looks good, it is unfortunately incomplete at the moment. There’s quite a bit of data missing. I would love to do some statistical analysis on the data, but with so many missing records there’s a good chance that my conclusions would be incorrect. I have already summarized my findings and passed them along to the team, so hopefully they can resolve the issues quickly!

I have already added functionality to ShareEdmonton for this data, and as soon as the datasets are fixed, I’ll release it. I hate to say “stay tuned” but there’s not much choice right now!

Recap: CityCamp Edmonton

Canada’s first CityCamp was held here in Edmonton on Saturday at the Robbins Health Learning Centre downtown. Roughly 50 people attended the unconference focused on innovation for municipal governments and community organizations. We had a nice mix of municipal employees, developers, journalists, and citizens.

We started the day off with this timeline of Edmonton’s open data journey (click for a larger version):

A brief history of open data in Edmonton

It was a joint effort to create this. Jess put it together with input from myself and Ashley, and Raffaella created a Prezi for us. I was struck by two things when reflecting on the timeline:

  1. This journey really didn’t start that long ago. I guess two years in the technology world is a long time, but it’s pretty quick in the world of municipal governments.
  2. I was instantly reminded of London’s tube map when I looked at the timeline, which is fitting as so much of our open data journey in Edmonton has been based around transit. It was the GTFS feed that ETS made available to developers that really kicked things off back in 2009.

With that foundation in place, we invited everyone to pitch their topics for the day. There was a nice range of topics suggested, everything from “Modeling the Value of Open Gov” to “Increasing Awareness of Apps Among Edmontonians”.

CityCamp Edmonton

Raffaella and Ashley acted as our gridmasters, and arranged the topics into the day’s agenda. We broke into groups and the discussions began!

CityCamp Edmonton

The sessions I participated in looked at the media’s role in open government, the importance of archiving and digital preservation, and the benefits of open data in small municipalities. I really enjoyed the discussions and I think everyone got something out of them, even if it was just inspiration or motivation to go away and do something!

CityCamp EdmontonCityCamp Edmonton

In the session on small municipalities, I thought Devin made a really great point. He said that open data adoption today is kind of like website adoption was 15 years ago or so. At the time, having a website was a new concept, and municipalities approached it much like they are approaching open data now – with uncertainty, hesitation, and even resistance. Today every municipality has a website. How did we get over those initial roadblocks? Devin suggested that tooling has a lot to do with it, which echoed some of the discussion we had in the media session earlier in the day. Tools like FrontPage really opened up the floodgates and made it easy for people to create a website. We have since moved on to better things, of course, but it was an important enabler early on. Perhaps we need the open-data-equivalent of FrontPage for open data to really take off as well. In the media session we identified tools as one of the things holding up wider adoption of open data by journalists.

A session I didn’t participate in but which looked like a lot of fun was the modeling open government one. Jess was determined to have at least one session that wasn’t sitting around in a circle talking, and he succeeded!

CityCamp Edmonton

The space we were in was great, with lots of natural light (which I think is really important), though it was somewhat difficult to find in the morning. Everything worked out though!

CityCamp EdmontonCityCamp Edmonton

Though we did have a discussion about actions arising from the day’s sessions, I think drilling down on collective actions is always difficult at events like CityCamp. For me, the day was an opportunity to connect with other people thinking about the same issues and topics. That said, here are a few things you can do to take action right now:

  • Look at the open data catalogue, and start using the data. Share the things you’re doing with it!
  • As you come up with ideas that require data sets that aren’t currently available, add them to the UserVoice. I will take an action to clean that site up a bit!
  • Notes from the day will be going up on Civic Commons, so that’s a great place to capture and share your thoughts on open government in Edmonton.

Thanks to everyone who participated on Saturday! You can see my photos from the day here, and Jess’ photos here.

Fun with Open Data and Excel: Edmonton’s Busiest Streets

Today the City of Edmonton added a new dataset to the open data catalogue – average daily street traffic volumes from 2004-2009. Here’s the description:

Include traffic counts obtained with automatic traffic recorders over the past six years. The volume shown is a total of all vehicles in both directions, over a 24 hour period, for a typical weekday in a year. Volumes shown as a dash "-" indicate no count was undertaken that year. Seasonal adjustments are made to reflect an average weekday during the year. An increase or decrease in volume does not necessarily indicate a trend for a given roadway. Road construction or the introduction of more advanced equipment in 2009 affect the traffic volume numbers.

I’d like to build something interesting with this data, perhaps as part of a future ShareEdmonton release. But to start, I decided to open the data up in Microsoft Excel, something I often do with new datasets. Here’s what I discovered.

First, a few summary points:

  • There are 1496 street locations in the dataset.
  • Of those, 823 were counted in 2009. The year with the most counted locations was 2006, at 1076. Just 32 locations were counted every year (2004-2009). There were 531 locations counted in three years or more.
  • One of the first things I noticed is that every count ends in zero. I know the description outlines that the data is an average, adjusted seasonally, and perhaps for other reasons, but I wonder how close to reality the numbers really are.

Looking at 2009 simply because it is the most recent, there’s a hint of a long tail for the counted locations:

Here are the 200 busiest locations in Edmonton according to the 2009 count:

To create that map, I used a free utility called Excel to KML. There are all kinds of useful free KML tools online!

Here are the top ten busiest locations in Edmonton, according to the 2009 count:

  1. Calgary Trail SW North of Gateway Park Road SW
  2. Capilano Bridge
  3. 178 Street South of 81 Avenue
  4. Highway 216 NE North of Sherwood Park Freeway NE
  5. Anthony Henday Drive North of  87 Avenue
  6. HIghway 216 NE North of Baseline Road NE
  7. Anthony Henday Drive West of Calgary Trail
  8. 170 Street North of  95 Avenue
  9. Groat Road North of Victoria Park Road
  10. Highway 216 NE North of Whitemud Drive NE

Some of those are expected, some perhaps not. I decided to look at locations that were counted in at least three different years. If you look at the average daily volumes for that subset, here are the top ten busiest locations in Edmonton:

  1. Quesnell Bridge
  2. Yellowhead Trail West of 231 Street
  3. Calgary Trail SW North of Gateway Park Road SW
  4. Capilano Bridge
  5. Whitemud Drive West of 149 Street
  6. Yellowhead Trail West of Fort Road
  7. Cloverbar Bridge
  8. Yellowhead Trail West of  97 Street
  9. Yellowhead Trail West of 107 Street
  10. Yellowhead Trail West of 127 Street

Plotting the top 25 on a map gives a better sense of the really busy roads – Yellowhead Trail and Whitemud Drive:

Interesting, isn’t it? Of course, it could get a lot more interesting with some mashups. I’d love to have collision data for the City of Edmonton, to see how closely the number of collisions is correlated with traffic volumes. That’s just one example.

Check out the new dataset in the open data catalogue. If you do something interesting with it, I’d love to hear about it!

Edmonton Election 2010: Visualizing Results by Polling Station

Ever wonder where the candidates in last month’s municipal election received the most support? Which parts of the city supported which mayoral candidates? After seeing the maps that were created for Calgary’s top three mayoral candidates, I wondered about the same kind of thing here. Local software developer Josh Kjenner was also interested, and he has been busy visualizing the results by polling station ever since.

Josh wrote an application called Metroview for the City of Edmonton’s Apps4Edmonton competition, a project which he spent about 60 hours on. The tool is implemented in Processing, a programming language and environment that Josh called “a really really intense Java library.” He returned to the project after the City of Edmonton released the final election results by polling station, and spent another 20 hours or so improving it. Josh told me the biggest challenge he faced was conditioning the KML files from the open data catalogue (a common challenge that open data developers face…getting the data and the tools/technology working together).

The result is an interactive application that lets you visualize candidate support and other data on a map of Edmonton.

Here are a few of the data visualizations you can see in Josh’s metroview yegvote 2010 app (requires Java).

Eligible voters versus voter turnout:

Support for Stephen Mandel:

Support for David Dorward:

Support for Daryl Bonar:

You can see that Mandel received most of his support from the south part of the city, while Dorward received the most support from the north part. You can use the metroview tool to see similar results for every ward, public school ward, and catholic school ward too.

Thanks Josh for creating this tool! This is another great example of what can be created when the data is open and available.

UPDATE: It should be noted that you can’t really compare Mandel’s graph to Dorward’s. A dark area in Mandel’s is not equivalent to a dark area in Dorward’s, for example, because of the difference in the number of overall votes that each candidate received. The colors on each graph are in relation to the other areas on that graph for that candidate only. If you look at Josh’s app, you get the raw values as you hover over each area, and you can choose absolute instead of relative for the drawing mode.

Open Data and Municipal Election Results

As local readers will know, I created an election results dashboard for the municipal election that took place in Edmonton on October 18, made possible thanks to the City of Edmonton’s open data. I’d say it was very well-received! There was lots of positive feedback, and it resulted in the highest-trafficked day ever for ShareEdmonton. There were also hundreds of tweets about the dashboard, including some from people in other cities.

I was able to update the dashboard on-the-fly that night, fixing the graph colors and other issues as they were identified. Overall I was pretty happy with how it turned out, though I wish I had been able to add a few more features in time for the big event. Over the last couple days, I decided to extract the dashboard from ShareEdmonton and I have now added that new functionality. Specifically, the page updates automatically (no more refreshing) and there’s a mobile view as well, so it looks decent on your mobile device.

New Dashboards

Today is election day in Ontario, and thanks to open data from Toronto, Ottawa, and London, I was able to launch three new election results dashboards, all featuring the latest improvements:

Some new issues have appeared that I didn’t have to worry about in the Edmonton election (for example, there are 40 candidates for mayor in Toronto, so having them all appear on the graph is difficult at best) but the sites all seem to be running smoothly. I guess we’ll find out at 8 PM EST tonight when the results start to come in!

Open Data

All of these dashboards were made possible because the cities made election results data available, so kudos to each of them for doing so. The tricky thing for a developer like me is that all four cities (Edmonton, Toronto, Ottawa, and London) made the results available in a different format!

  • Edmonton – XML/JSON using OGDI
  • Toronto – plaintext, pipe-separated
  • Ottawa – plaintext, HTML scrape, kind of a pseudo-CSV
  • London – XML

Fortunately, when I had created the dashboard for Edmonton, I had built in a translation-layer. So instead of loading directly from the City’s catalogue into ShareEdmonton, I loaded it first into an internal format. So to get the dashboard working with the other cities, all I had to do was write that translation piece, from their catalogue to my internal format. As you can see, that strategy has worked fairly well (Ottawa was by far the most difficult, and did not provide me with enough information to calculate voter turnout, so that was removed from the ShareOttawa dashboard).

I’m not complaining about the need for this translation layer. I would much rather have a city make its data available than delay just to try to find a common format. But I do hope to see convergence over time. It would be great if these cities (and others that offer this data, like Vancouver) could agree on a common format. That would remove the extra work required to make an application reusable, and would hopefully result in even more applications that make use of the data.

And Beyond!

I’m pretty excited about the possibilities of open data, especially as it relates to politics and democracy. There are some really great apps being built, such as Vote.ca, and we’re really just scratching the surface. If we keep at it, I’m confident that open data will have a positive impact on the way we engage with politics.

City of Edmonton launches Apps4Edmonton Competition

On Wednesday the City of Edmonton officially launched its Apps4Edmonton competition, which challenges residents to submit ideas for apps and developers to actually build them. There is more than $50,000 in prizes available, and everyone has a chance to win an Apple iPad. Here’s what the competition is all about:

Every Edmontonian can be an active participant in reshaping our city. Together with community partners the City of Edmonton is proud to launch Apps4Edmonton – a contest which encourages residents to develop applications that will benefit Edmontonians.

Using data sets from the Edmonton Open Data Catalogue, we’re challenging you to develop an app for either a smart phone, mobile device, or PC web browser. Mash up a map, create a visualization, or analyze data in a new way, the choice is yours.

To support the competition, the City has also released an update to the Data Catalogue. There are now 25 datasets available, including Ward boundaries and a list of City facilities. Even more datasets should be available soon, and if there’s something specific you’d like to have, request it from opendata@edmonton.ca.

If you have an idea for an app, submit it here. It can be anything, so be creative! Even if your idea isn’t possible or a developer doesn’t want to take it on, it might serve as inspiration for other apps, so don’t be shy. If you’re building or have already built an app, submit it here. You have until August 27 to do so. The FAQ has some good info, and be sure to familiarize yourself with the rules too.

Applications will be judged on four criteria: Accessibility, Usability, Creativity, and the number of community votes received (voting runs online from August 27 to September 10). In addition to three overall prizes (Gold, Silver, Bronze) there are six categories:

  • The Way We Live
  • The Way We Grow
  • The Way We Green
  • The Way We Move
  • The Way We Plan
  • The Way We Prosper

I’m very happy to see that IT has aligned itself with Transforming Edmonton for this competition! I am hopeful that Apps4Edmonton can help introduce more Edmontonians to those important documents that help guide us toward becoming a more innovative, inclusive, and creative city.

To learn more about Apps4Edmonton, visit the contest site. There should be lots of chatter about the competition at Startup Weekend too, and tonight at the Emerging Business Leaders’ Patio Party.

I can’t wait to see what everyone comes up with!