Social Media and the Edmonton Storm

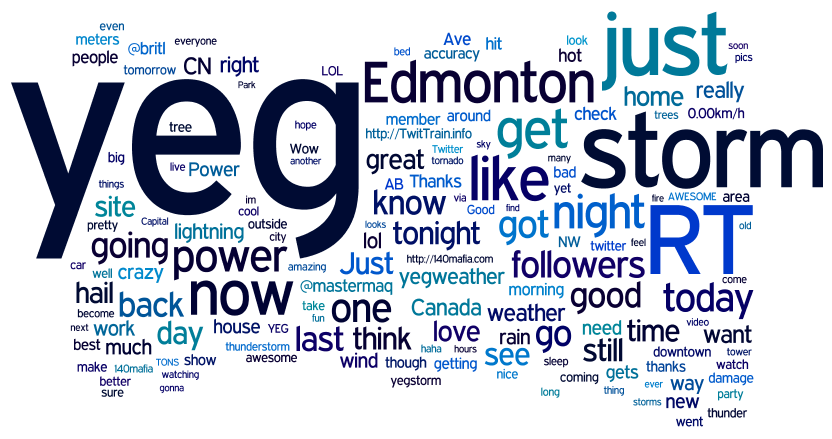
As you probably know, a violent storm passed through Edmonton on Saturday evening, causing lots and lots of damage around the city. Emergency services, Epcor, and the local media all had a very busy weekend, and the cleanup will likely continue for days. Users of Twitter, YouTube, and other social networks also had a busy weekend, posting thousands of first-hand reports as well as dozens of photos and videos online. In this post I recap some of the highlights.

Twitter played a big role in the storm of course, which means that I received a number of phone calls from the local media today. I was interviewed for the evening news on both Global and CBC, and will be on CBC Radio tomorrow morning at 6:15am. Why do they call me? Because I have the data to back up my observations, and now you will too!

From July 18th at noon until July 20th at noon, local users posted 14456 tweets. Of those:

1640 were tagged #yeg, #yegstorm, or #yegweather
462 contained TwitPics
682 were retweets
2024 contained links

To put these numbers into context, I compared them with the average of the three previous weekends:

As you can see, each category was higher than normal. Of particular interest to me, was the number of tagged tweets. During the 48 hours of the storm and aftermath, local users posted 4.3 times as many tagged tweets as they do on a normal weekend. There was a definite spike at the height of the storm:

That got us into the trending topics on Twitter, and spam bots and non-local users helped push up as high as #6:


Photo courtesy of Brittney Le Blanc, iNews880

There was a lot of information being posted on Saturday night, so I decided to aggregate the best of what I saw using CoverItLive. The tool has changed a lot since I last used it, but I got up and running pretty quickly. You can see the stream here. Some stats on the live stream:

283 different people followed along
92 total comments were submitted
259 tweets were aggregated
70 other items were posted (I was listening to the radio and adding extra comments)

One of the people following the live stream was Evan Adnams, who at the time was in North Carolina! He took the information in the live stream and started plotting it on a collaborative Google map that has since been viewed nearly 13,000 times.

I know for a fact that the local media used Evan’s map to find out where they should send their cameras. Users continue to update it too, which is great!

As I mentioned, lots of videos were posted online. This video by Trevor Prentice is probably the most watched of them all, racking up over 30,000 views:

There were also dozens of photos posted (check out galleries at CTV Edmonton and iNews880). This one by Brittney Le Blanc was not only the most retweeted photo during the storm, but it also immediately put to rest rumors that the CN Tower had collapsed:

I think that’s an important point. People often say it’s great that you can post stuff on Twitter in real-time, but who’s going to do the fact checking? The answer, of course, is everyone. Citizens like Jerry Aulenbach, who posted a number of TwitPics, joined forces with members of the mainstream media like Brittney to do the fact checking. Josh Classen and Mike Sobel posted frequent weather updates on Twitter based on the data they had, and citizens augmented that with live reports from all around the city. The Edmonton Journal, which couldn’t publish on Sunday due to power outages, kept its website up-to-date with a combination of articles written by its reporters and links to the social media resources I’ve mentioned above.

It was a truly collaborative effort, and it won’t be the last time we see social and mainstream media teaming up to get the job done.

Notes for 7/19/2009

Here are my weekly notes:

The Last 24 Hours on Twitter: Storm in Edmonton

We’ve been dealing with a pretty massive storm here in Edmonton for the last 24 hours or so (Edmonton Journal, iNews880). At one point last night, every fire hall in the city was dealing with some kind of storm-related issue. Epcor has been taxed dealing with power outages, and I’ve heard nothing but sirens downtown.

As expected, many Edmontonians turned to Twitter to communicate about the storm. At one point last night, #yeg was the 6th most talked about item on all of Twitter. I was aggregating tweets together on a livestream that you can look at here.

Here’s what the last 24 hours looks like for local Twitter users:

Since noon yesterday, there have been just under 8000 tweets posted by local users, most of them with the #yeg hashtag. Other popular tags include #yegweather and #yegstorm.

Storm in EdmontonStorm in Edmonton

There have been dozens of photos and videos posted online too. The two above are a couple that I took last night before things got really crazy. The two most popular TwitPic’d photos from last night were:

Lots of cleanup happening around the city today, though the wind and rain are still quite intense at times. I’ll have more on this tomorrow!

Edmonton Notes for 7/18/2009

Here are my weekly Edmonton notes:

Idea: Proud Edmonton Tech Company badge

Edmonton SkylineThings have definitely improved in the last couple of years, but Edmonton still has a reputation as something of a dead zone for innovation. Or perhaps more accurately, we don’t really have a reputation – we’re not on the radar in most cases. It’s not true of course, there are plenty of interesting and innovative projects, companies, and people in Edmonton. The challenge is making others aware of them.

There are a variety of ways to do that. One is through the media, both traditional and new. Such mentions tend to be fleeting, however. Another way is through events such as DemoCamp, though those typically benefit only the locals. These are important, and we should keep doing them, but we need something else as well.

As I thought more about the problem, it occurred to me that we could learn something from other industries. There are two organizations in particular that do a good job of boosting local companies – Original Fare and Keep Edmonton Original. You can find their logos at independent restaurants and retailers around the city, and I think seeing them reinforces the notion that we have more than just big box stores and chains. What if we had something similar for technology companies?

For tech companies, the web is important. It’s often the first point of interaction. As such, it’s always been a pet peeve of mine that so many local tech companies seem afraid to mention on their website that they are based in Edmonton:

I’m not trying to suggest that any of these companies have intentionally left Edmonton out, but I do think there is room for improvement.

So here’s the idea: what if every local tech company put a badge on their website that says “Proud Edmonton Tech Company”? What kind of an impact would that have? I think it would definitely help with awareness.

For most companies, placing the badge on the front page probably doesn’t make sense. Nexopia, for instance, has a very large external audience that probably doesn’t care that the company is located in Edmonton. Others will simply want the front page to look a certain way. Nearly every company has an about page however, and it’s on that page that I think such a badge would be featured (and maybe on the contact page too). Where would the badge link to? I’m not sure. I’m not even sure it has to link anywhere.

What do you think?

Edmonton Police Service (EPS) Crime Mapping tool now online

Back in June we learned that the Edmonton Police Service was planning to launch a new website that would enable citizens to find crime statistics for their neighbourhoods. This afternoon, the EPS Crime Mapping tool went online, and it does just that. You can search for stats on eight types of crimes in any neighbourhood across any time period since 2007. From the press release:

The new crime mapping tool will provide members and citizens with a better understanding of what is going on the neighbourhoods they work and live in.

I’ve been playing with the site today, and I like it. There are pros and cons, however.

How It Works

The first step is to agree to the disclaimer – more on that in a minute. Next, you pick the crimes you want statistics for. The eight types include assault, break and enter, homicide, robbery, sexual assaults, theft from vehicle, theft of vehicle, and theft over $5000. Third, you pick the neighbourhood – there are 357 listed in the system. Finally, you select the time period. There are some quick selections such as yesterday or the last 30 days, or you can enter any two dates. Click “Show Crimes” and your neighbourhood appears on the map, covered in colored dots to represent the reported crimes. Here’s what Oliver looks like for the last 30 days with all crime types selected:

There’s also a “View Statistics” tab above the map that will show you a table for the last three years broken down by month, with a graph below that.

The Good

There are some really good things about this site. First and foremost, the data is excellent. I’m glad that they included everything up-front, instead of doing a test release or something to start. Second, it’s built using Google Maps. This is a big win for EPS – it’s a stable technology that Google is continually making better, and I would guess that most Edmontonians are familiar with it. Third, it’s fast. Almost as soon as you click the button, your stats appear.

The Bad

There are two things about the site that I don’t like. First is the disclaimer – it’s too restrictive. These two points in particular are problematic:

While it is acceptable to pass the website link on to others in your community, you will not share the information found on the website with others other than with members of the Edmonton Police Service or other law enforcement agencies; and

You will only use this website and the information in it so you can inform yourself of, and participate in, this community policing initiative;

That effectively means you can’t do anything with the data. This is in direct contrast with what the press release would lead you to believe:

Providing our citizens with the real picture of neighbourhood crime is the first step in engaging them to do something about it. Members of the public will be better equipped with knowledge to work collaboratively with the EPS to reduce and prevent crime.

What’s the point of making the data available if you can’t do anything with it? Why can’t I blog about the crime stats in a particular neighbourhood? Or mash the crime stats up with some other data? I challenge the notion that simply being able to see the dots on a map equips me to do something about crime in my neighbourhood.

I’ve emailed the feedback address listed on the site asking about this, but I haven’t yet received a response.

The second bad thing about the site is that while it does make data available, it does so in an opaque and closed way. If Edmonton is going to become an open city (with respect to data), sites like the crime mapping tool need to provide information for multiple audiences. One is the average citizen who is happy to click around on the map. Another increasingly important audience is the creative professional who wants to do something with the data, and needs it in a machine-readable format such as a CSV or XML file.

The Undocumented API

The first thing I did after testing the site with my neighbourhood was poke around for clues about where the data comes from. It didn’t take long to realize that there’s a JSON web service behind the application. You can access it here. It’s probably not meant for public consumption, but it’s there and it works. I was able to throw some code together in about 30 minutes to get data out of the service. While it would still be good to have static data files available, the API largely negates the con I mentioned above. As it is unofficial however, who knows if it will remain active and working, so enjoy it while you can.

Final Thoughts

Overall I think the Crime Mapping tool is excellent. We need more applications and services like this, though with less restrictive terms/licensing and easier-to-access data. Kudos to EPS for building this, and let’s hope they improve it.

UPDATE: There are more details in this article. For instance, the tool apparently cost $20,000 to build, and is automatically updated each morning.

State of the Calgary Twittersphere – June 2009

Welcome to the fourth State of the Calgary Twittersphere, my look at the intersection of Twitter and Calgary. You can see last month’s stats here.

The source of the data this month remains the same – Twitter Search. If a user has his or her location set to Calgary, Airdrie, Okotoks, Cochrane, Strathmore, or matching lat/long coordinates, they are considered a Calgarian. If a tweet is “about Calgary” it contains either the word Calgary, the #yyc hashtag, or both.

For June 2009:

# of local users: 5646 (a decrease of 215 from May)

To clarify, that means there were 5646 users who posted at least one tweet in June 2009 with their location set to something that makes them a Calgarian as described above. This number should be treated as a minimum – there are probably many more Calgary users without their location set or that were not captured for some other reason. See additional analysis below.

# of tweets by local users: 207245
# of tweets by local users containing #yyc: 4269 (2.1%)
# of tweets by local users that were replies: 68737 (33.2%)
# of tweets by local users containing links: 48114 (23.2%)
# of tweets by local users that were retweets: 6637 (3.2%)
# of tweets by local users that were twooshes: 8865 (4.3%)

Here are the numbers above in graphic form:

Here are the top clients used by local users for posting updates (remember that web includes all unidentified API calls too). A notable new entry is UberTwitter:

Since I’ve been playing with some temperature data from Environment Canada lately, I decided to plot the average temperature against the number of tweets for each day in June:

Do people tweet more when it’s colder outside? I’m not sure the graph really tells us. What’s clear however is that people tweet less on the weekends!

Some other interesting stats for the month:

Finally, here are the top ten users in Calgary by followers (most followers first): douglasi, OksanaIrwin, ahhhgolf, twitty7x, strategicsense, CrazyMechanic, broatch, nolanmatthias, ThankASoldier, tessaru

Analysis

Like the Edmonton stats for this month, the Calgary stats don’t look that impressive. Some people have abandoned Twitter, it’s the summer, and as was pointed out in the comments on the Edmonton post, the Iran Election probably impacted my stats as some users changed their location to Tehran.

There are some encouraging signs, however. The increase in tagged tweets this month surprised me – maybe #yyc will try to catch up to #yeg! Also, since I started recording the stats for Calgary back in March, I have identified just over 11,000 local users. The number above, 5646, is how many of them were active in June.

I didn’t monitor things as closely in June as I do normally, so there’s a chance I might not have captured all of the data. In particular, I’m not sure if June 13th/14th was really that low or if there was a data import error of some kind. Either way, I think the data above represents the overall trends accurately.

I’ll be making some changes to hopefully boost the accuracy of the numbers in July.

State of the Edmonton Twittersphere – June 2009

Welcome to the sixth State of the Edmonton Twittersphere, my look at the intersection of Twitter and Edmonton. You can see last month’s stats here.

The source of the data this month remains the same – Twitter Search. If a user has his or her location set to Edmonton, St. Albert, Sherwood Park, Leduc, Nisku, Stony Plain, Fort Saskatchewan, Beaumont, Spruce Grove, or matching lat/long coordinates, they are considered an Edmontonian. If a tweet is “about Edmonton” it contains either the word Edmonton, the #yeg hashtag, or both.

For June 2009:

# of local users: 3642 (a decrease of 871 from May)

To clarify, that means there were 3642 users who posted at least one tweet in June 2009 with their location set to something that makes them an Edmontonian as described above. This number should be treated as a minimum – there are probably many more Edmonton users without their location set. See additional analysis below.

# of tweets by local users: 172295
# of tweets by local users containing #yeg: 9411 (5.5%)
# of tweets by local users that were replies: 64281 (37.3%)
# of tweets by local users containing links: 31937 (18.5%)
# of tweets by local users that were retweets: 7532 (4.4%)
# of tweets by local users that were twooshes: 6453 (3.7%)

Once again, the number of tweets containing #yeg actually includes all local hashtags, such as #yegtransit or #yegfood (though most often they are used together anyway).

Here are the numbers above in graphic form:

Here are the top clients used by local users for posting updates (remember that web includes all unidentified API calls too, though they are changing that). A notable new entry this month is UberTwitter:

I’ve been playing with some temperature data from Environment Canada lately, and it occurred to me that I could visualize it against my Twitter data. Here is the number of tweets posted and the average temperature for each day in June:

Do people post more when it’s warmer or when it’s colder? The only thing I can be sure of is that there are always less tweets posted on the weekend. Beyond that, there seemed to be more tweets posted at the beginning of the month when temperatures were cooler, but obviously this is in no way scientific!

Some other interesting stats for the month:

Finally, here are the top ten users in Edmonton by followers (most followers first): Pat_Lorna, revtrev, LesM, subunit1, garrymullen, mastermaq, redneckmommy, NHL_Oilers, karlkovacs, dan_cote. It would take a lot more time to generate, but a top ten list ranked by local followers would probably look much different.

Analysis

This month’s stats don’t look very good! The numbers haven’t been this low since March. There are definitely users who have abandoned Twitter, but I think the time of year probably has an effect as well. Presumably people are outside enjoying the weather, tweeting less often! A preliminary look at the numbers for July suggests to expect more of the same for next month’s stats.

The good news is that since January, I have identified nearly 9000 local users. The number above, 3642, is how many of them were active in June.

I didn’t monitor things as closely in June as I do normally, so there’s a chance I might not have captured all of the data. In particular, I’m not sure if June 14th was really that low or if there was a data import error of some kind. Either way, I think the data above represents the overall trends accurately.

I should have the stats for Calgary up by Thursday. Stay tuned!

UPDATE: The Calgary stats for June are here.

UXCamp Edmonton – July 18th

Edmonton’s first UXCamp is being held on Saturday! Organized by Cam Linke of BarCamp fame, Jess McMullin from nForm, and Marc Brisbourne, an instructor with MacEwan’s Design Studies program, UXCamp is a free, one-day event taking place at MacEwan downtown. Here’s what it’s all about:

UXCamp is for people who want to learn and share about user experience, design, usability, information architecture, user interfaces, service design, and anything and everything else about creating better products and better experiences.

Edmonton joins a growing list of cities that have hosted UXCamp, DesignCamp, or InteractionCamp events. Like BarCamp, the schedule is open – anyone can sign up to present in a 20 minute time slot. You can read more about what they’re expecting for presentations and how the day will progress here.

Here are the details for UXCamp Edmonton:

Date: Saturday, July 18, 2009
Time: 9am – 5pm
Location: 9-202, Robbins Health Learning Centre (104th Ave, 109th Street – map)
Cost: Free

The event is limited to 100 people by the venue, so make sure you register now. If you’re interested in sponsoring, click here. Should be a great event!

Social Media and the City Centre Airport Debate

Where there’s smoke, there’s fire.

On Thursday morning Jeff Samsonow and I chatted about the City Centre Airport for a few minutes on CBC Radio. During the interview I was asked if I thought social media played a role in the debate. I answered, “absolutely”.

Also on Thursday, Graham Hicks mentioned the “rise of youth” in his column, observing that “the younger demographic flexed its muscle” and that “the "social media" was solidly anti-airport”. He specifically mentioned myself, Jordan Schroder, Dave Cournoyer, and Michael Janz.

Scott McKeen got things rolling on Friday with his column in the Edmonton Journal, stating that “a new reality emerged along with a new establishment.” He too mentioned age:

Blogger Mack Male used Twitter to go live from council chambers during the final debate. In one Twitter post, he wrote: "There is a silver-haired guy in the audience shaking his head during Don Iveson’s remarks."

Global Edmonton’s Linda Nguyen interviewed me Friday for a piece that aired during the evening news (click on “silent majority” because their video system sucks). Councillors Iveson and Krushell were also interviewed for the story, and cited the use of social media by young people as a trend to keep an eye on.

On Saturday, Todd Babiak’s column in the Edmonton Journal took the story to another level. He interviewed both myself and Jordan Schroder, and said:

It must have been devastating for the city’s most powerful men and women to watch a group of virtually connected–but politically unconnected–young people creating and controlling public debate with speed, elegance and respect.

Is it just coincidence that so many stories on the same topic appeared over the last few days? Were they all just trying to avoid another negative comment from Cal Nihols and his side? Maybe, but I think there’s more to it than that.

Social Media Lessons

Social media definitely played a large role in the City Centre Airport debate, on both sides. As I mentioned in my post introducing NotMyAirport.ca, AEG made use of social media for its campaign too, though the local media seems to have glossed over this fact. David MacLean was active on Twitter, and actually was the first to use the #ecca hashtag that has become so popular. You may know that I didn’t create the Not My Airport group on Facebook, Jordan Schroder did. I just looked for the largest pro-closure group and linked to it – Jordan then renamed it and made me an admin. David told me a similar thing happened with their side’s Facebook group. David and I both took part in the web debate hosted by FusedLogic, and we both encouraged others to email their councillors.

All of which begs the question, if both sides had such similar stories, why were the pro-closure side’s social media efforts so much more effective? The fact that, at least in my opinion, we had a stronger case notwithstanding, I believe the following reasons are key:

  1. Blogging

    Blogs are still the stars of social media. The pro-closure side made use of blogs quite extensively. Myself, Dave, Michael, Adam, Adam, and Jeff all blogged about the issue numerous times, and I’m sure there were others too. A blog has many benefits, but three in particular played a role here: a place to expand on thoughts and to lay out facts, a good ranking in search engines, a place for others to leave comments and have a conversation. The pro-Muni side didn’t have any blogs, and they missed out accordingly.

  2. Consistency

    Perhaps the most important thing you can do when you have a blog is to post regularly. I did that, as did others. We were also consistent with other tools. We kept the Twitter stream updated, and we regularly sent messages to our Facebook group and posted on the wall. The debate seemed more alive because we were consistent with our communications.

  3. Using the right tool for the job

    Blogs are great for sharing a relatively large amount of information. Twitter is great for short, real-time bits of info. Here’s an example: I listened to the live stream for the public hearings, and Twittered about it in real-time. The pro-Muni side was nowhere to be found. Similarly, I live tweeted the final decision, because that’s what Twitter is good at. The pro-Muni side again was silent. Even the web debate is a good example – I suggested it because I knew it would give us time to explore the issues and a chance for others to converse online.

  4. No distractions

    You might call it grassroots or simply having no money, but the pro-closure social media efforts were not affected by other “distractions”. The billboards, lawn signs, etc. all have an impact – in this case, they made the pro-Muni side seem like it had some money, and that took away from the authenticity of their social media efforts.

Over the weekend, Adam and Dave wrote about Babiak’s story. Both suggested that there’s more to the story than just young people using social media. I agree with them. If age played any role, it’s that young people are more comfortable with social media tools and thus used them more effectively. That’s a bit of a generalization, however. There were young and old people on both sides of the debate.

Final Thoughts

There’s no doubt in my mind that the City Centre Airport debate and the role social media played in that debate will have a lasting impact on politics in Edmonton. Having said that, it’s important to realize that change doesn’t often happen overnight. Just as it will take years for the airport itself to give way to something new, political decisions will continue to be made the way they always have been, at least for the foreseeable future.

The difference now, I hope, is that social media has been legitimized in the eyes of our local political system and should see greater use in the future.

I think that’s something to be proud of.